The receive queue as the flow id: four netmap rings for Suricata on the XGS 136, 2026-11-11
Suricata in IPS mode reads the XGS 136's ports through netmap's emulated adapter. That adapter puts a received
frame in the ring its flow id names (FreeBSD's netmap_generic.c), and npuep gave its frames no flow id, so
with dev.netmap.generic_rings at 4 every frame still went to the first ring.
What changed
dev.npuep.0.giu.rx_flowid, 0 by default: at 1 a received frame carries as its flow id the number of the receive queue the coprocessor put it in. The coprocessor picks the queue by a hash of the connection, so both directions of one connection land in one queue and several connections spread over the four. A forwarded frame then leaves on the transmit queue of the same number.- Nothing else: at 0 the receive path is as it was.
How it was measured
The XGS 136 (vendor version 21, four CPUs, its coprocessor set up for four queues), OPNsense 26.7.8_2 on
FreeBSD 15.1-RELEASE-p6, its release module in /boot/modules. The module with this change was built on the
appliance against its own kernel's sources (md5 08faabba) and loaded in place from a test directory for the
runs; the release module was loaded again after them, /boot/modules untouched.
- Intrusion Detection in IPS mode on Port8 (
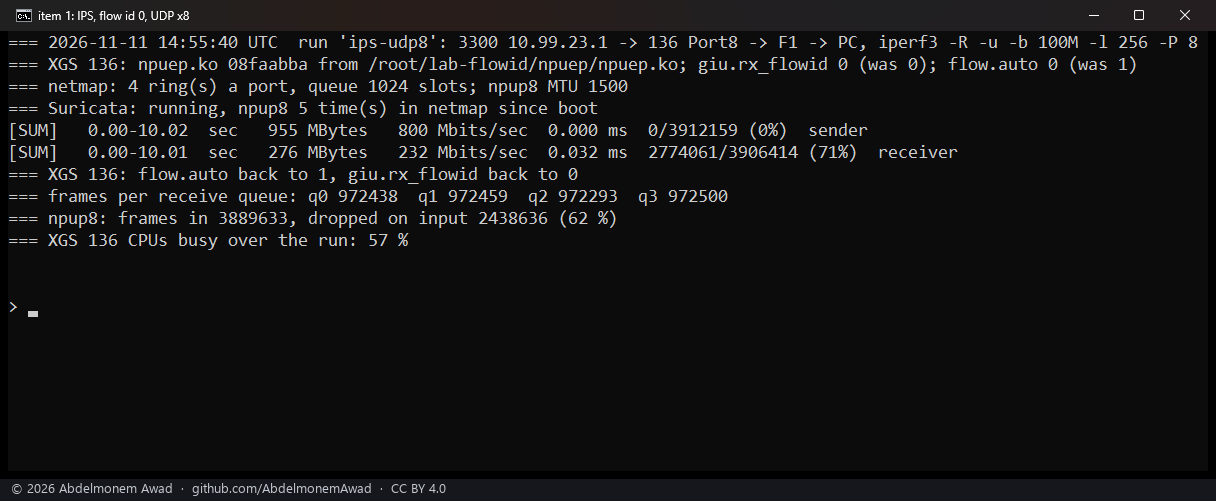
npup8), withdev.netmap.generic_rings=4and the port at MTU 1500, and the driver's automatic acceleration at 0 for each run (dev.npuep.0.flow.auto, which XGS: Settings "Accelerate connections automatically" writes), so every frame crossed the host and Suricata. - The traffic from the second XGS 3300 through the XGS 136's Port8 and out of its F1 to a PC, 10 seconds each with iperf3: eight UDP flows of 100 Mbit/s in 256-byte datagrams, eight TCP streams, and one UDP flow of 800 Mbit/s. The setting at 0, then at 1, back to back.
- Read on the XGS 136: how many frames each receive queue took, what
npup8dropped on input (netmap's ring full), and how busy its CPUs were over the run.
Results
| Run | Setting | Received | Lost end to end | Dropped at the ring | CPUs busy |
|---|---|---|---|---|---|
| IPS, eight UDP flows | 0 | 232 Mbit/s | 71 % | 62 % | 57 % |
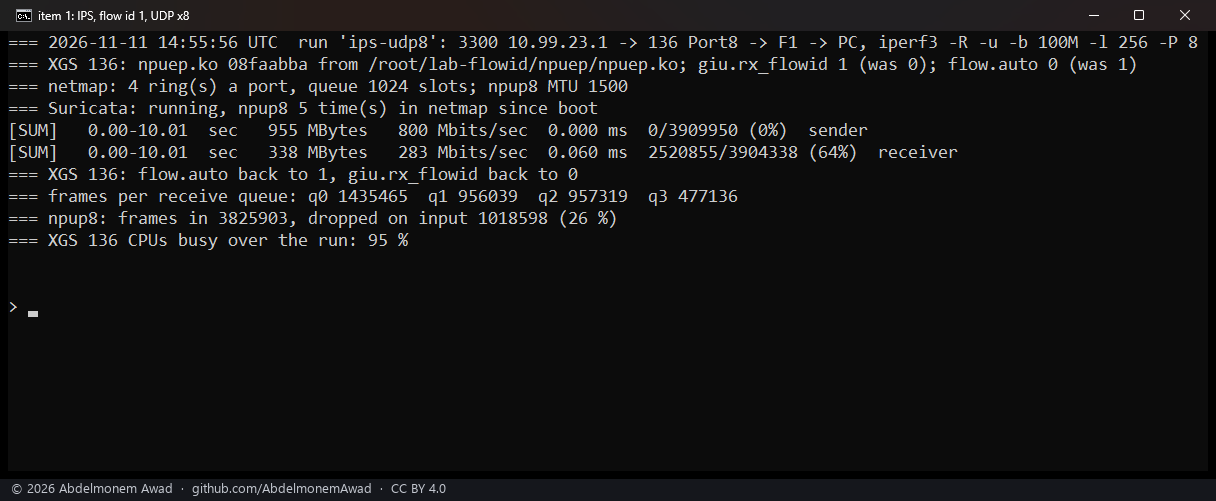
| IPS, eight UDP flows | 1 | 283 Mbit/s | 64 % | 26 % | 95 % |
| IPS, eight UDP flows, a pair two minutes earlier | 0 | 265 Mbit/s | 67 % | 63 % | 54 % |
| IPS, eight UDP flows, a pair two minutes earlier | 1 | 334 Mbit/s | 58 % | 12 % | 92 % |
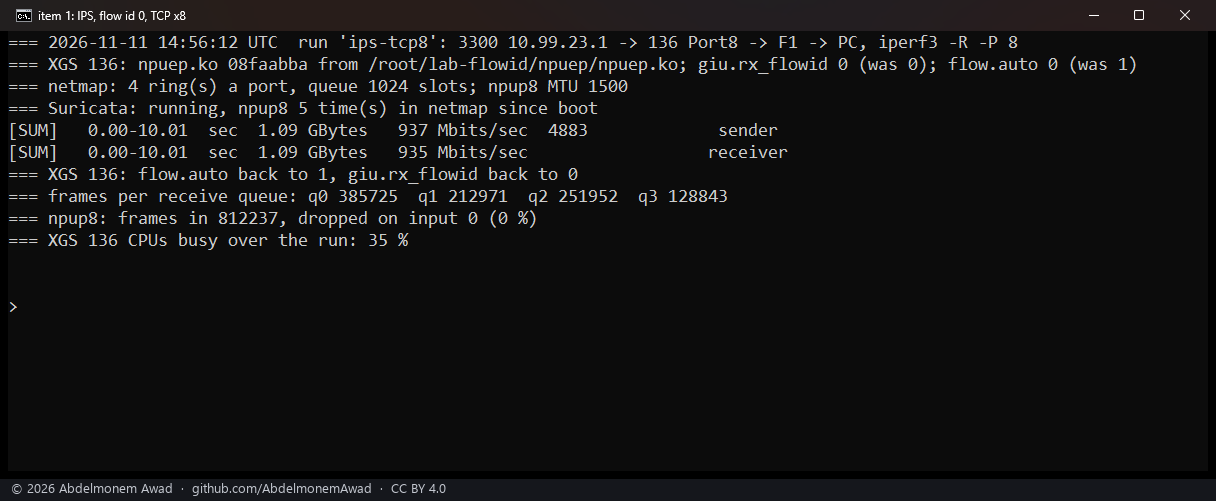
| IPS, eight TCP streams | 0 | 935 Mbit/s | - | 0 % | 35 % |
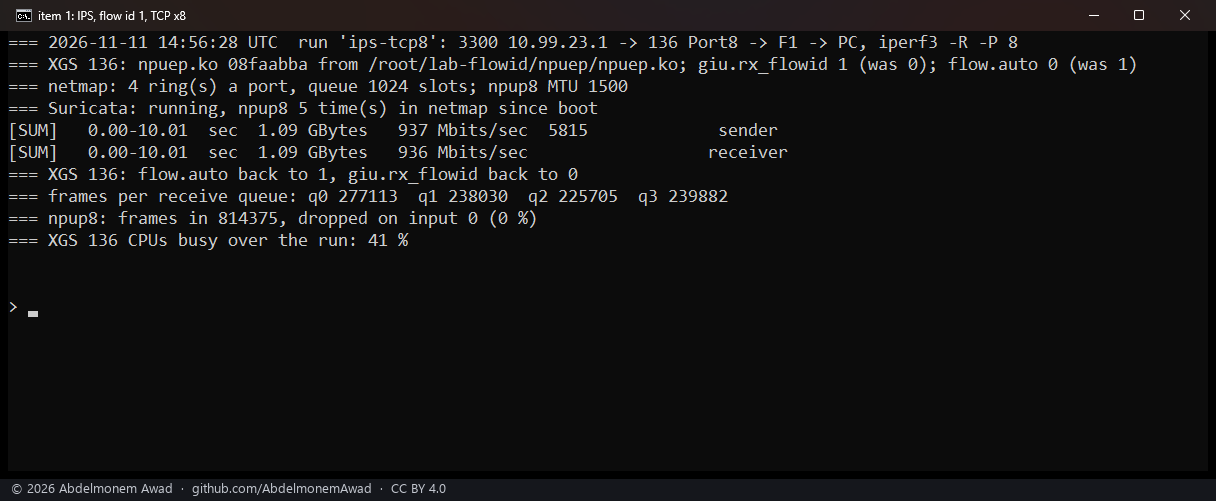
| IPS, eight TCP streams | 1 | 936 Mbit/s | - | 0 % | 41 % |
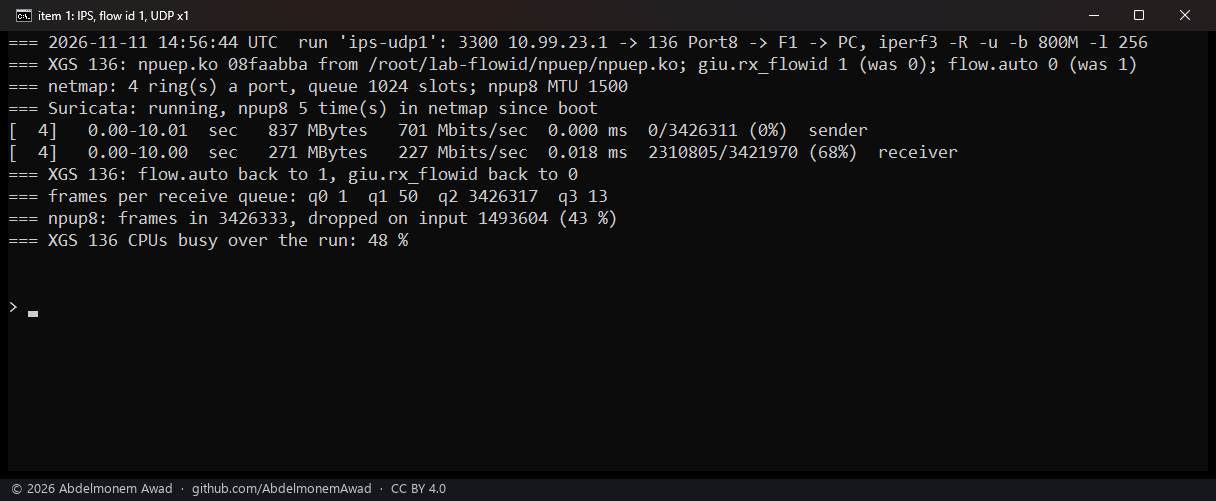
| IPS, one UDP flow | 1 | 227 Mbit/s | 68 % | 43 % | 48 % |
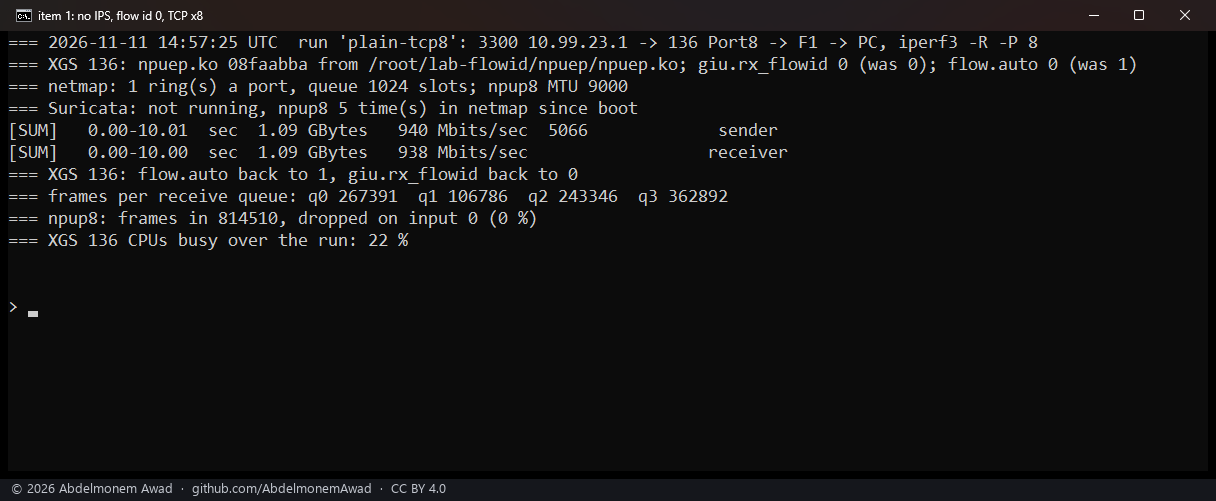
| no IPS, eight TCP streams | 0 | 938 Mbit/s | - | 0 % | 22 % |
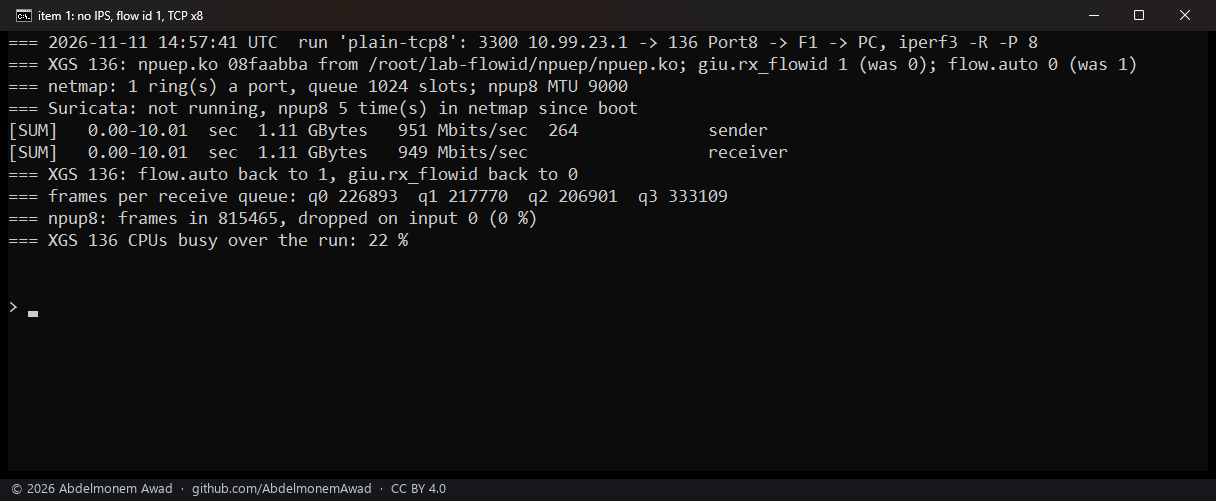
| no IPS, eight TCP streams | 1 | 949 Mbit/s | - | 0 % | 22 % |
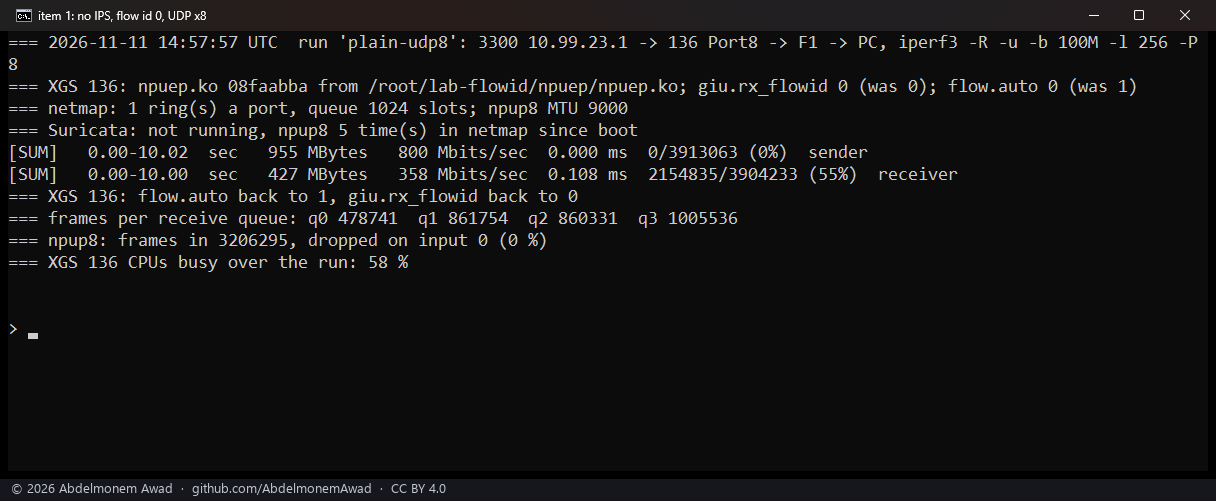
| no IPS, eight UDP flows | 0 | 358 Mbit/s | 55 % | 0 % | 58 % |
| no IPS, eight UDP flows | 1 | 387 Mbit/s | 51 % | 0 % | 48 % |
- Eight UDP flows through IPS: 22 and 26 % more received, and netmap's drops fell from 62-63 % to 26 and 12 %. The gain follows how the eight connections fell over the queues, which their hash decides: 3, 2, 2 and 1 in the photographed pair's queues gave 26 % dropped, two in each in the earlier pair's gave 12 %.
- The CPUs are the limit then, at 92-95 % busy against 54-57 %: four Suricata threads do more work, not the same work faster.
- One flow gains nothing: all its frames are in one queue, so in one ring, whatever the setting - 227 Mbit/s, about what eight flows reach with the setting at 0.
- TCP through IPS is the same either way (935 and 936 Mbit/s): eight streams that slow down when frames are lost never filled the one ring.
- Without IPS nothing was lost: TCP 938 to 949 Mbit/s, UDP 358 to 387 Mbit/s with the CPUs 48 % busy against 58 %.
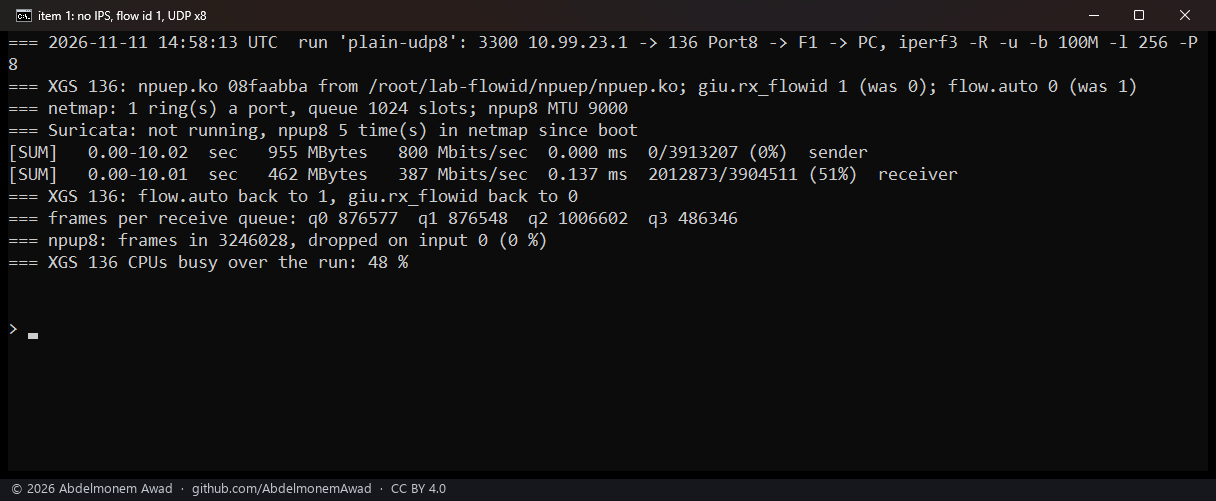
What it does not mean
- It is not the fastest way to run IPS here. With "Inspect, then hardware" on, Suricata sees each new connection's start and the coprocessor carries the rest (the measurement); this setting matters only where every frame must cross Suricata.
- Most of the UDP is still lost end to end, at both settings: the flows offered 800 Mbit/s of 256-byte datagrams, more than the host forwards through Suricata at either setting.
- Only the XGS 136 was measured, and only npuep has the setting.
To use it: XGS 136, System: Settings: Tunables, dev.netmap.generic_rings at 4 and dev.npuep.0.giu.rx_flowid
at 1, then Intrusion Detection restarted so Suricata opens its four rings. At a boot OPNsense sets its tunables
after the plugin's early hook has loaded npuep (/usr/local/etc/rc runs the early hooks, then rc.bootup,
which sets them), so both are in place before Suricata starts. The runs above set them by hand; a boot with
them set was not run.
The discussion of this page is held in the project's GitHub Discussions. Showing it here loads giscus from giscus.app and GitHub, and writing in it needs a GitHub account - what that means.