XGS 136 host with every coprocessor access timed: HTTP thirty times, six recoveries in place, 2026-11-04
1005: in the review before the release, the XGS 136's host stopped once in fourteen HTTP runs with a new connection for each response - no panic, no dump, and its hardware watchdog restarting it 128 s later. 988 is a stop of the same kind after a recovery in place. Read side by side, the two records point first to an access to the coprocessor that never completes: a host processor held in a read of the device, the others stopping behind it. On 2026-11-04 (UTC) the same load ran thirty times on the lab's XGS 136 (vendor version 21), with instruments that would name such an access. The host lived all thirty runs. In 683 million accesses to the coprocessor, the slowest took 158 us. Then #988's case ran six times with the same instruments - the coprocessor stopped, taken up again in place, and the ten-minute cron setting its clock back from 2097 about a minute and a half later - and the host lived all six (below).
The bench
The load is the one of the HTTP page: curl for Windows on the PC, four
processes of 256 transfers at once - 1,024 connections - each asking for one file of 524,288 bytes
again and again for forty seconds with Connection: close, so that every response is a new connection;
the server one lighttpd on the second XGS 3300 behind the 136's Port8; the 136 forwarding by its
coprocessor (the flow maker on); before each run pf's states flushed and the flow table left to empty,
as in the release check.
One change: the clients are on the PC's port on the 136's F1, not on its LAN port. The PC's port on the LAN has failed again and again on this bench (carrier lost, a link at 100 Mbit/s, receive errors), so it carries no measurement any more; the 136 now routes every response from Port8 to F1, where #1005's run went from Port8 to its LAN bridge.
The instruments
- A lab build of npuep (not published), alpha.13's driver with one addition: each read and write of the coprocessor by the driver's facilities marks its processor's entry before the access and clears it after, in a critical section, so that an access that never completes leaves its entry set for the kernel debugger to print. It also counts the accesses, those slower than 100 us, and keeps the slowest with its offset and which part of the driver made it. The module was in place before the boot.
- The kernel debugger, entered by a panic or by a BREAK on the console, runs a script that prints every processor, those entries and every thread into a textdump, then restarts the host.
- A logger on the host, a line every half second synced to its disk: interrupts, where the processors' time went, the driver's heartbeat and gone latch, the scripts running and the access counts.
- A watch from the PC on two links of the host's own, echoes every 2 s, to time a stop.
- The coprocessor's console log read before and after each run: a reset of the coprocessor prints a new boot there.
The host's console was in use by another program on the PC, so no BREAK could have been sent: a stop would have been read from the logger, the watch and what the next boot kept.
Thirty runs
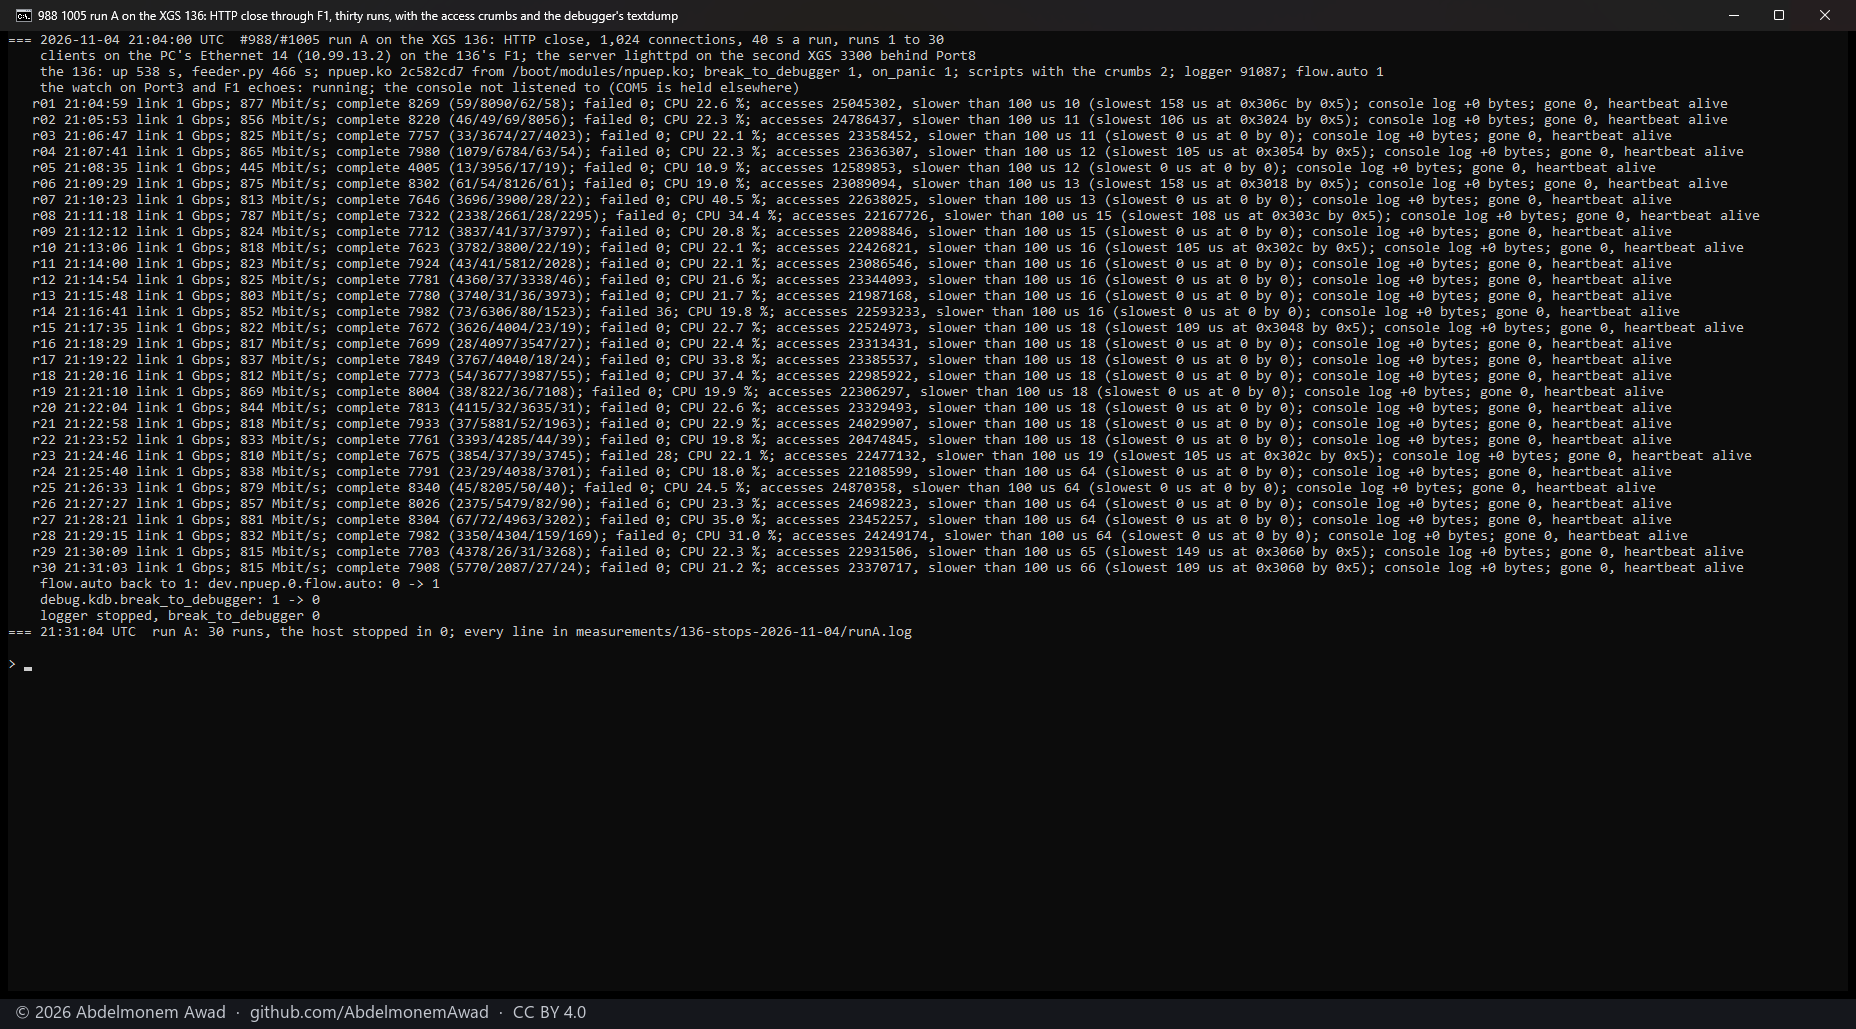
| over 30 runs | |
|---|---|
| the host stopped | 0 of 30 |
| delivered at the PC, from second 20 to 30 | 825 Mbit/s on the median (445 to 881) |
| responses complete | 232,536; 7,802 a run on the median (4,005 to 8,340) |
| responses failed | 70, in three runs (36, 28 and 6) |
| the host's four processors busy | 22.3 % on the median (10.9 to 40.5) |
| accesses to the coprocessor | 683 million; 23.1 million a run on the median, about 530,000 a second under the load |
| accesses slower than 100 us in a run | one or two, in 10 of 30 runs; none in 20 |
| the slowest | 158 us |
| the coprocessor | not reset in any run: its console log did not grow, its heartbeat answered, the gone latch 0 |
The slowest access of every run that had one was a read of a ring index the coprocessor owns, in the receive and transmit path (105 to 158 us). Thirty runs that live put #1005's stop under this load below about one run in ten, at 95 %: (0.9)^30 is 0.04. They do not show its cause, and two things were not as on 2026-11-03 - the path (F1, not the LAN bridge) and the driver (the lab build, whose critical sections keep an access on its processor).
One burst of slow reads came between two runs, not in one. At 21:24:48, as pf's states were flushed before run 24 and the flow table emptied, 45 accesses in half a second took longer than 100 us. The slowest of them, 113 us, was a read of the doorbell table in the control window, which the driver reads four times each time it rings a doorbell (the number of doorbells, an address in two halves and a value) - as it does for every command it posts to the coprocessor. The build keeps the offset of the slowest only, so what the other 44 were is not known. No other flush before a run did this.
Two of the four clients took nearly every response. In 29 of 30 runs two clients had over 95 % of the responses between them, not always the same two; the other two completed 42 and 37 on the median. Failures stayed few - 70 in all - so their transfers were slow, not refused. The earlier HTTP runs kept no count per client, so whether this comes from the PC's port, the 136 or curl is not known.
#988's case: six recoveries in place
On 2026-11-02 the host stopped 17 s into the first every-ten-minutes cron after a recovery in place, two
minutes and twenty seconds after the coprocessor had been taken up again. One job of that cron is
npu-clock.sh: after a new boot the coprocessor's clock reads 2097, and the job sets it back to the
host's - about seventy years in one step - which made it a suspect of its own.
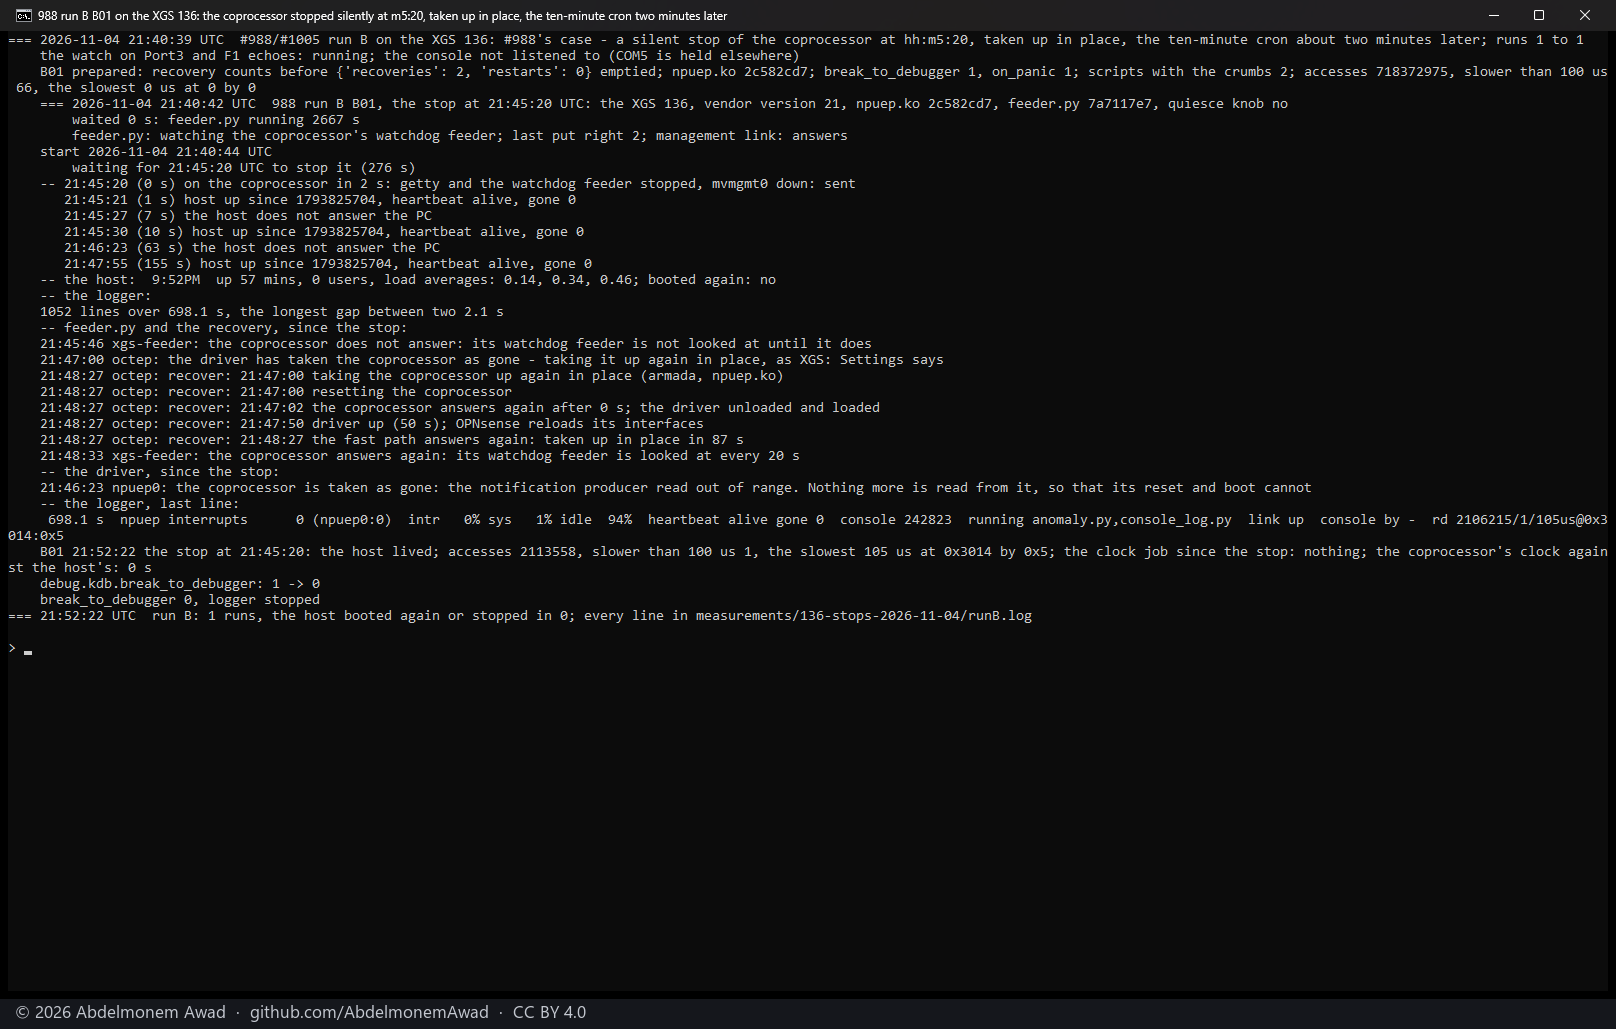
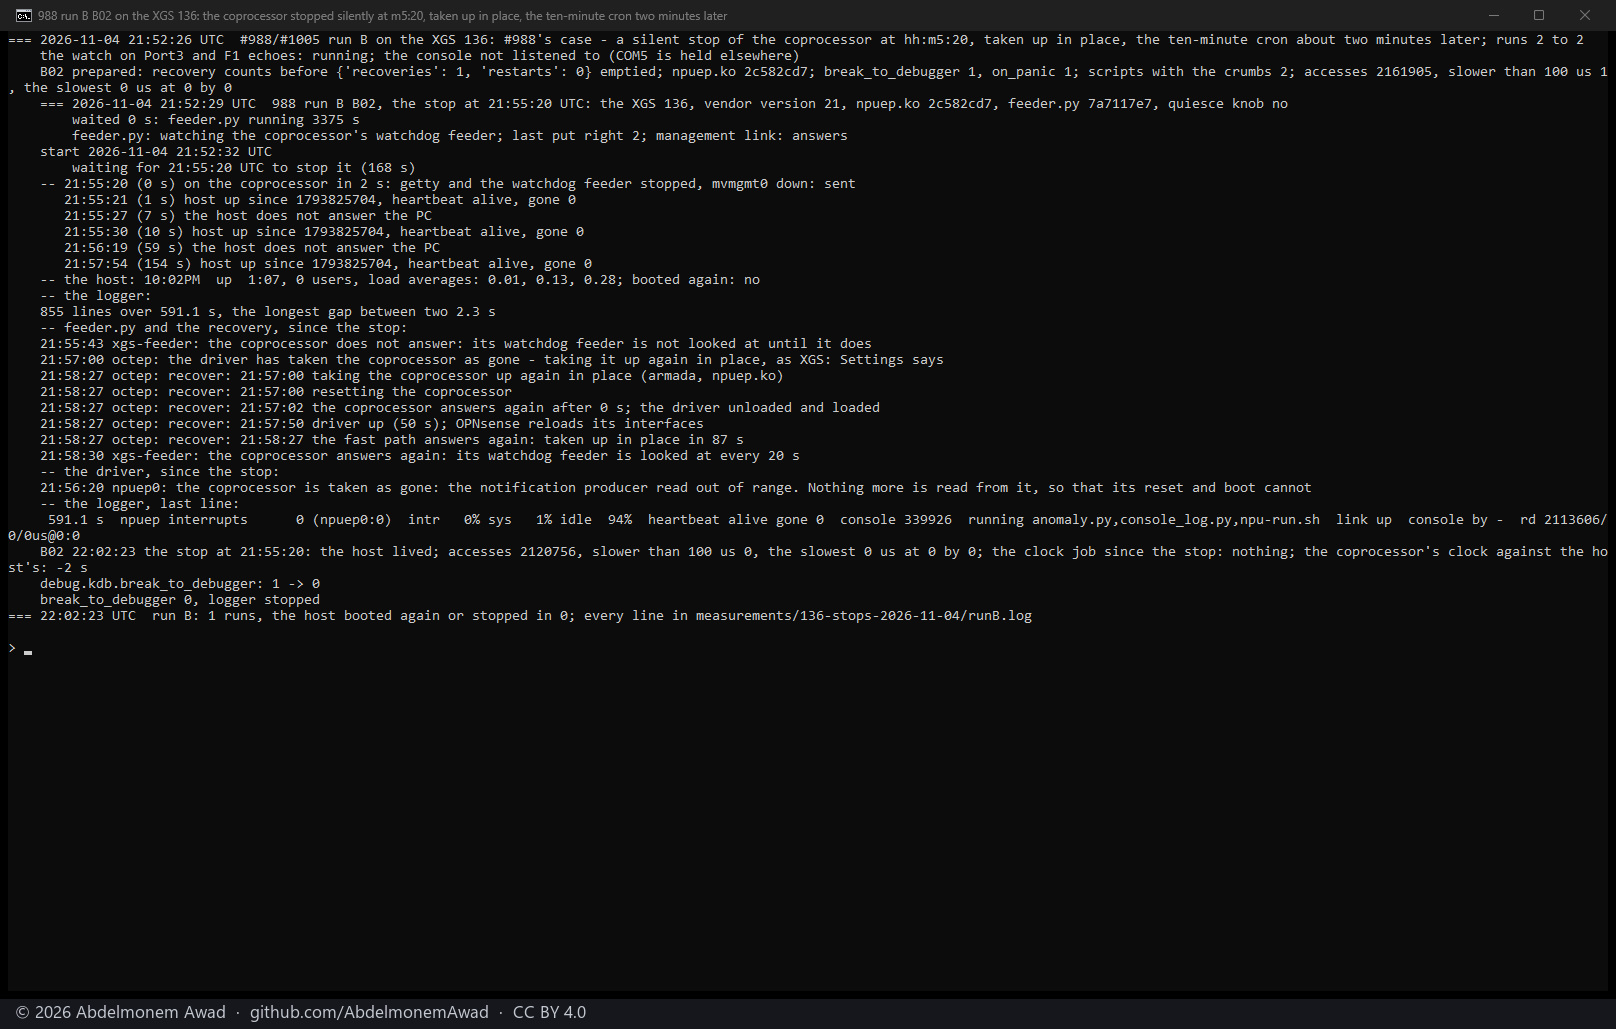
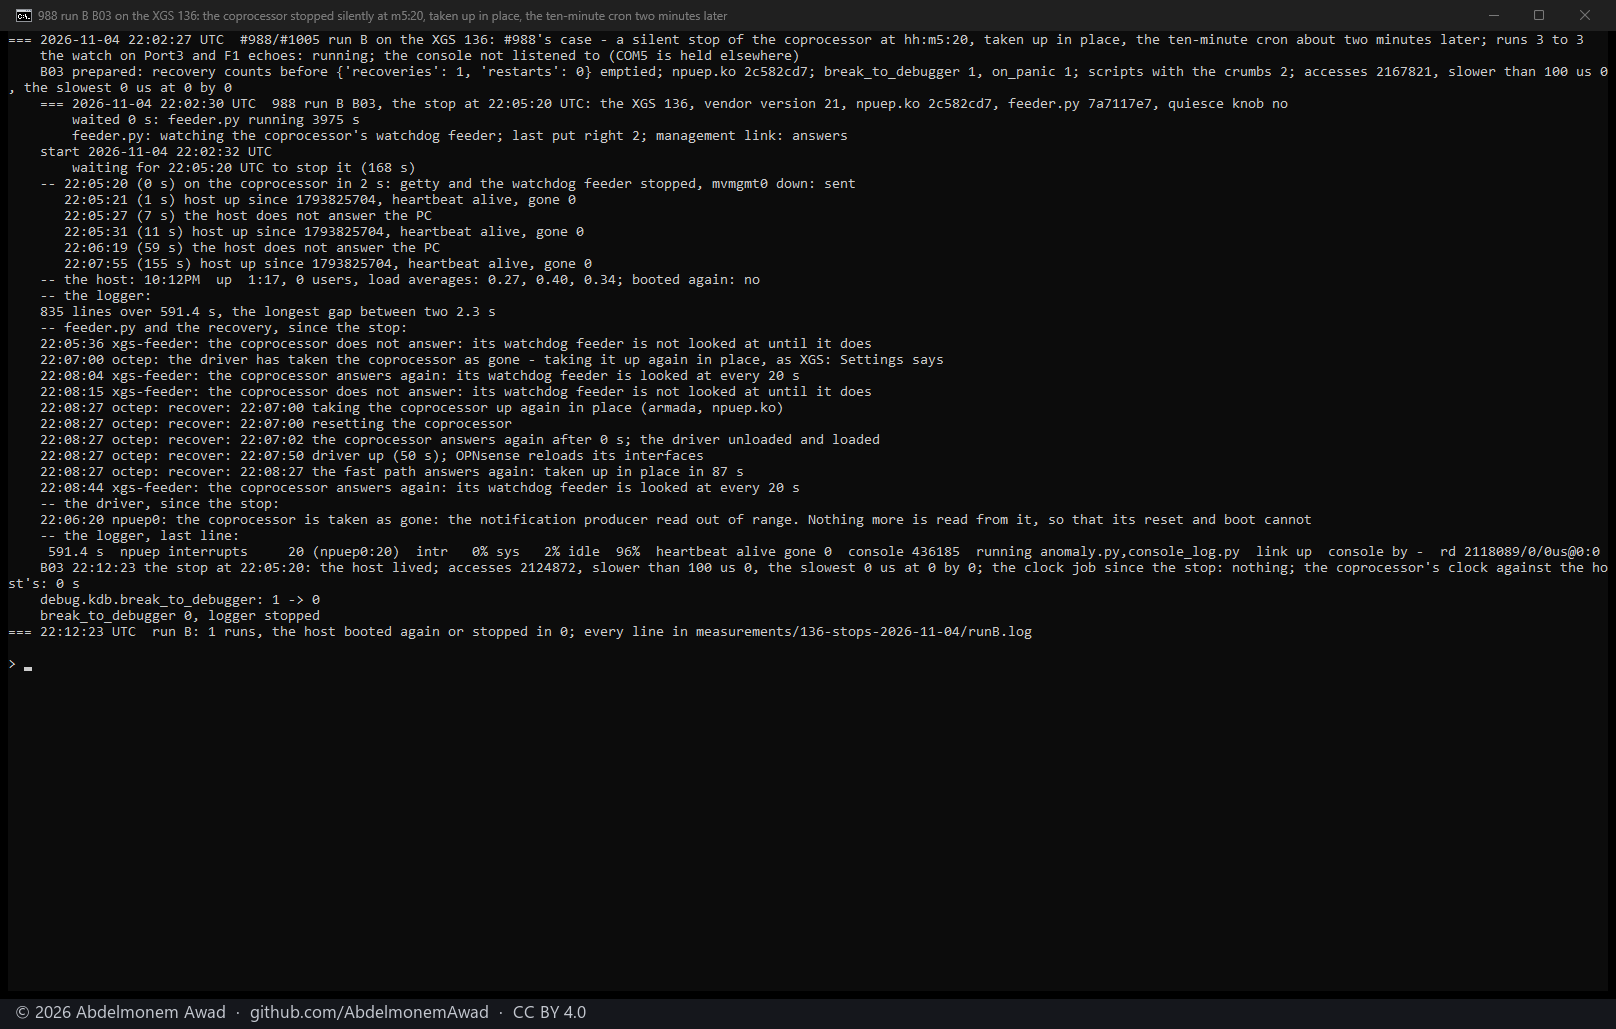
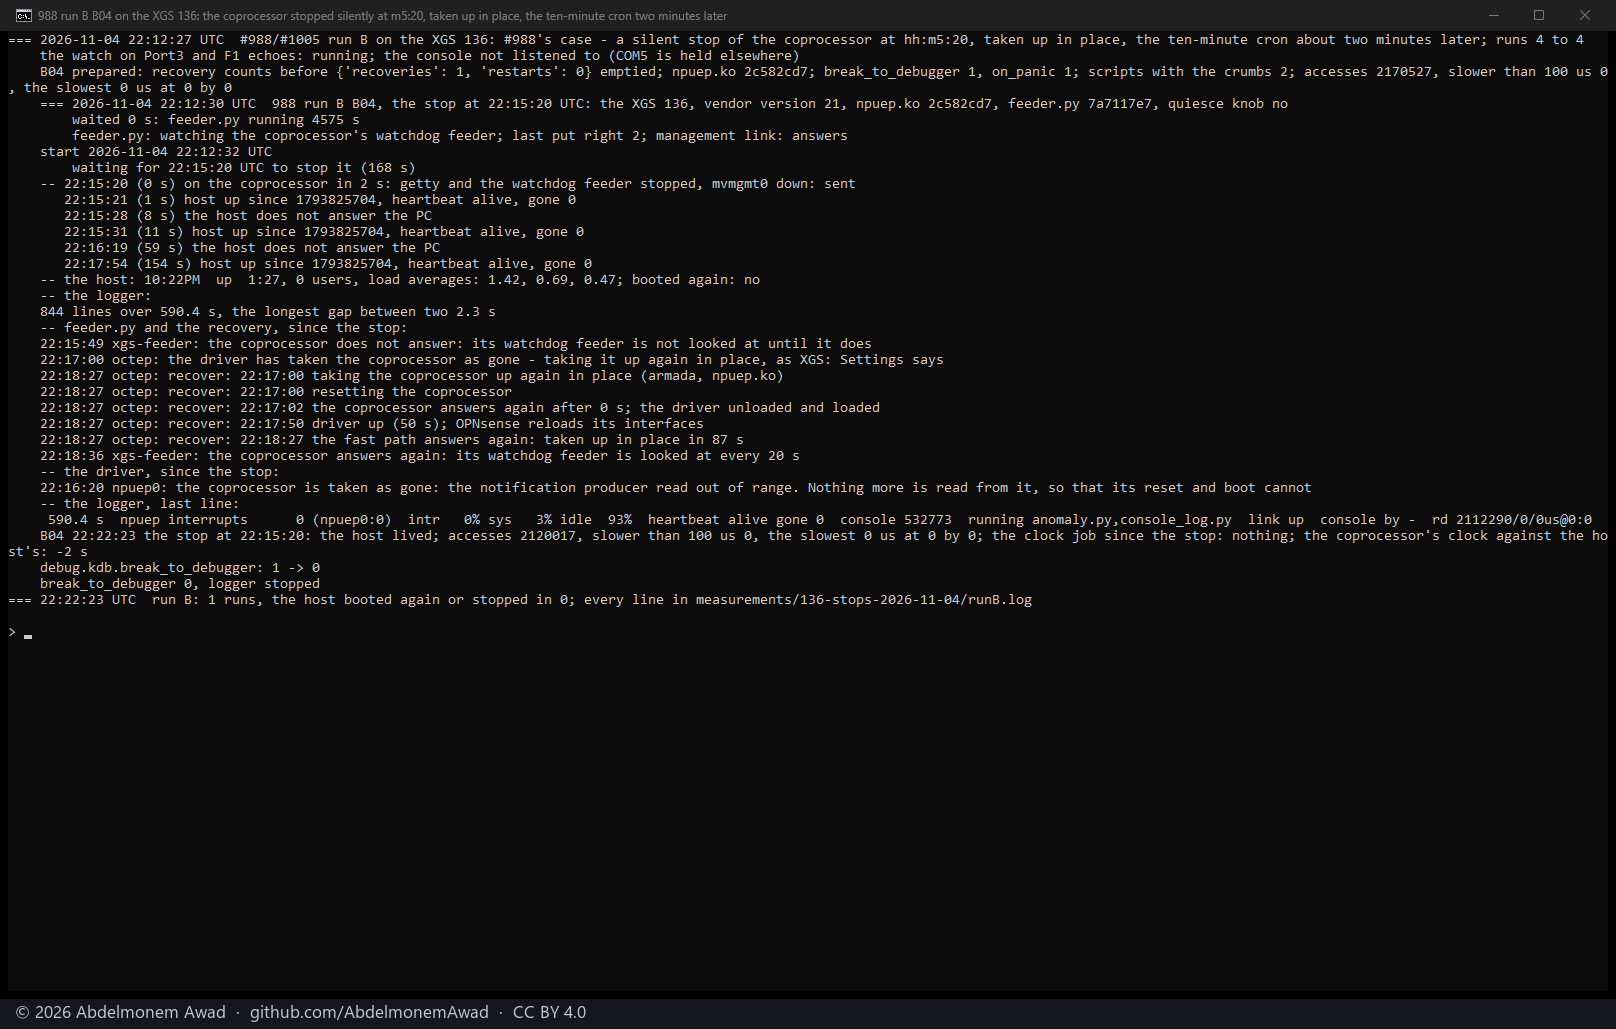
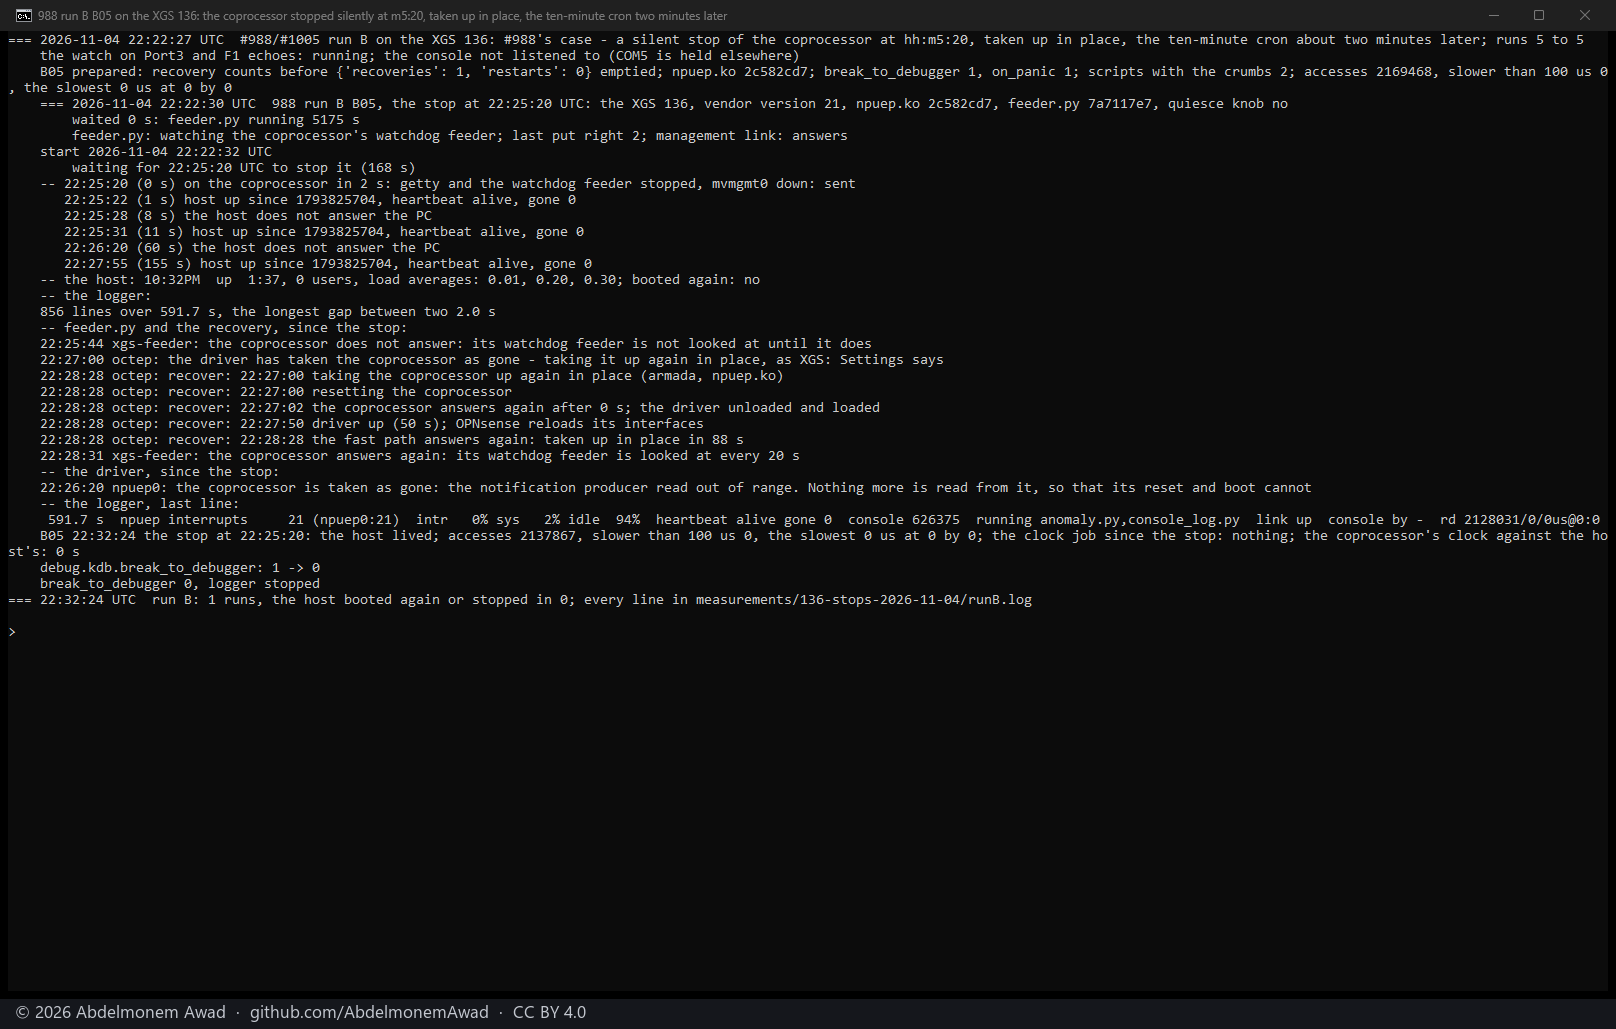
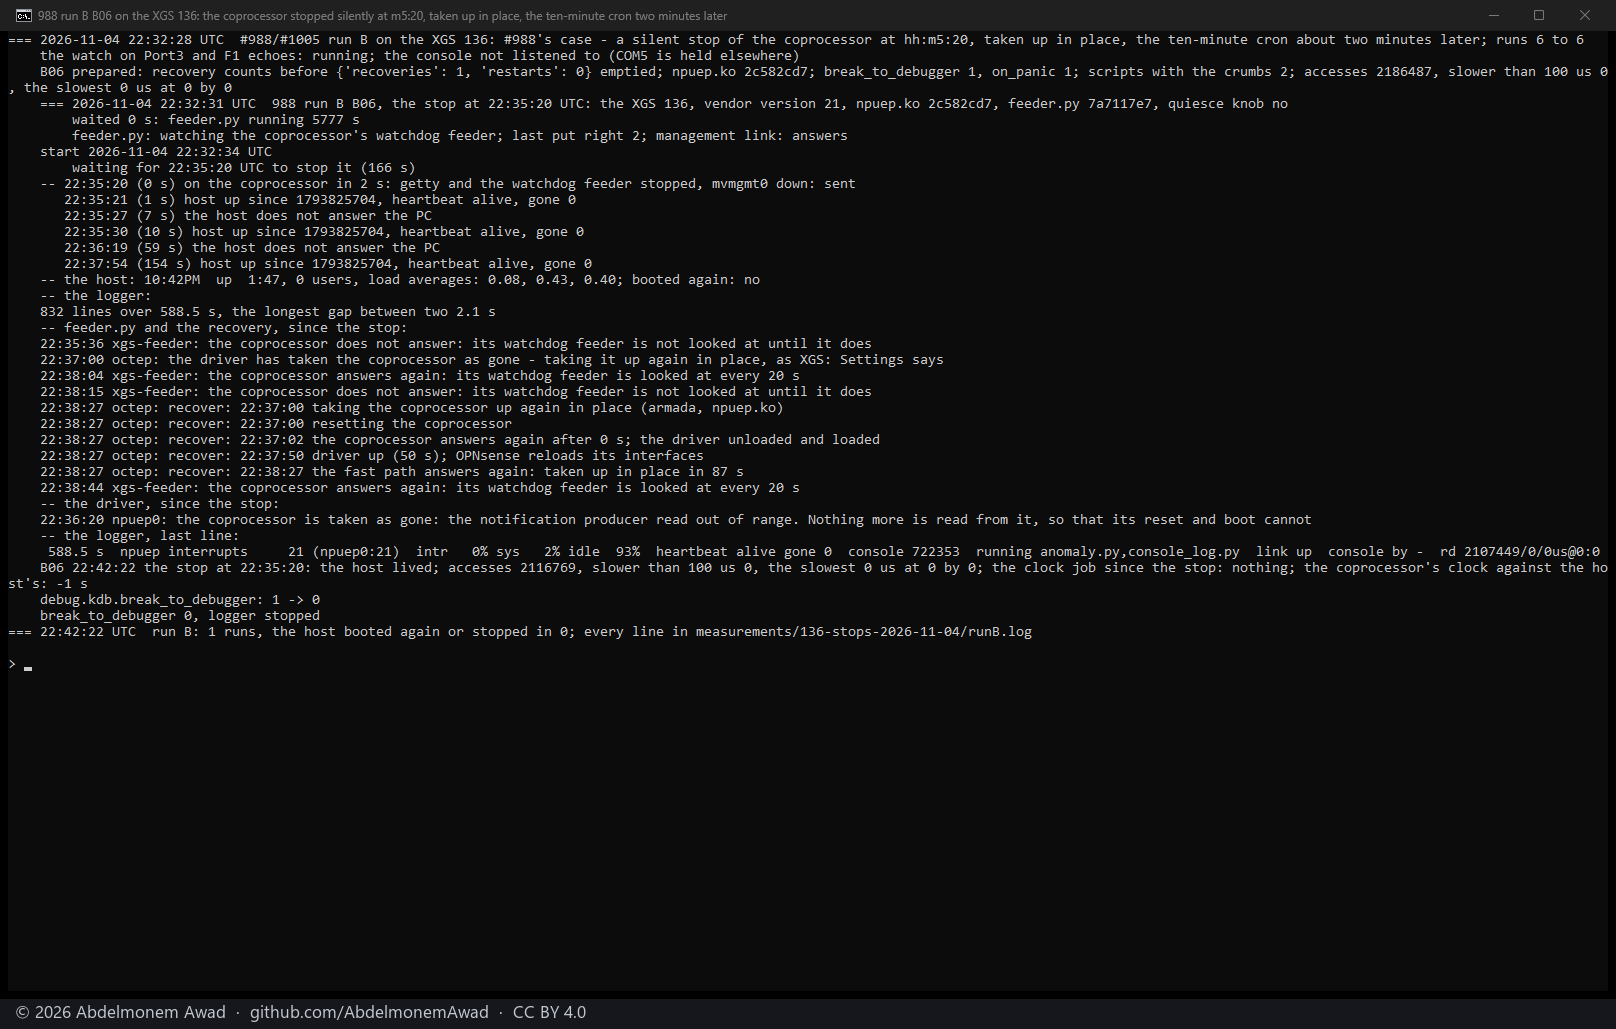
With the same lab build and debugger settings, the coprocessor's Linux was stopped six times, at 21:45:20 and every ten minutes after it: its console's getty and its watchdog feeder stopped and its end of the management link taken down, so that its own watchdog reset it while the host went on. The recovery counts were emptied before each run, so that each was taken up in place and none by a restart of the appliance. Each run is one photograph; the PC watched the host for seven minutes from the stop.
| each of the six runs | |
|---|---|
| the driver took the coprocessor as gone | 60 to 63 s after the stop ("the notification producer read out of range") |
| the recovery in place | began 100 s after the stop; the fast path answered again 87 or 88 s later |
| the ten-minute cron | 93 or 94 s after that: npu-clock.sh set the coprocessor's clock back - "it read 2097-07-24 04:41:57 UTC", the same each time |
| the host | never booted again; its logger's longest gap 2.0 to 2.3 s |
| accesses slower than 100 us | one in the first run (105 us, a ring index read), none in the other five |
The clock's step happened all six times and the host lived each time, so the second half planned for this case - six more runs with the clock job taken out of the cron - had nothing left to separate, and was not run.
Corrected in the photographs: each run's last line says "the clock job since the stop: nothing". That is wrong - my script looked for the job's lines in the system log, and the job writes to the plugin's own log, where all six are (21:50:01, 22:00:01, 22:10:01, 22:20:01, 22:30:01 and 22:40:01). The lines "the host does not answer the PC" at about 7 and 60 s are the PC's way to the host, which crosses the coprocessor's ports on this appliance - the host's own logger ran on without a gap over 2.3 s.
What is next
The same instruments on #988's case: a recovery in place, ending about two minutes before the every-ten-minutes cron, six times, then six more with the coprocessor's clock not set by that cron.Run above: six of six lived, and the second half was not needed.- A BREAK on the console at a stop, once the console is free for it - with the PC's watch of the host held while the coprocessor is down on purpose: on this appliance both of the PC's ways to the host cross the coprocessor's ports, and they went silent for about 90 s in every run of #988's case.
- The doorbell table, if the slow reads matter: it changes only when the coprocessor arms its doorbells, so it could be read once then and not four times for every doorbell.
The discussion of this page is held in the project's GitHub Discussions. Showing it here loads giscus from giscus.app and GitHub, and writing in it needs a GitHub account - what that means.