The review before the next release, 2026-11-03
The candidate for the next release - main at 2a000ea - checked against v0.1.0-alpha.12, the release
the appliances have now, on the lab's three appliances, each on OPNsense 26.7.8_1 (FreeBSD
15.1-RELEASE-p6): the first XGS 3300 (vendor version 23), the second XGS 3300 (vendor version 22) and
the XGS 136 (vendor version 21). Between the two, four installed files differ - the driver's module with
its kernel stamp, feeder.py and fastpath.py - from
989,
991,
993,
995,
996 and
998. In the tables A is v0.1.0-alpha.12 and B
the candidate. Times are UTC. Automatic problem reports were off on all three for the review, and
fastpath.py's count of recoveries in a day was emptied first, so that no recovery was held back by the
tests before.
What it found
| where | what | issue | state |
|---|---|---|---|
| npuep, since 996 | devctl detach npuep0 panics the host |
1000 | fixed in 1007, run on the XGS 136: the detach 1 of 1, reloads under F1's loads 3 of 3 |
| npuep, since 995 | the attach's early exit leaves its sysctl context allocated, empty | - | fixed in 1007, not reached on hardware |
| feeder.py, since 989 | its watch never arms while its looks are slow; one stop after a boot missed | 1001 | fixed in 1008 |
| feeder.py, with 1008 | a look blinds the watch while it lasts and is then lent whole: a stop of the coprocessor's Linux inside a slow look was decided after its reset (F3b again) | 1012 | open: 2 of 2 froze the host |
| feeder.py, since 989 | SysRq keys sent after its own quiesce, toward the coprocessor's boot firmware | 1003 | fixed in 1008, seen working 2 of 2 |
| 998 and its page | a pending bit down while masked read as a message never made | 361 | corrected in 1009 |
| feeder.py | with the management link down, a stopped watchdog feeder is not put right before its reset | 1002 | open: 2 of 2 froze the host; made on purpose after the merges (F12), main froze it 1 of 1 and the fix prepared for it kept it up 2 of 2 - not in a pull request yet |
| mgmt-link.sh, the XGS 136's family | it types into the coprocessor's console without the console's lock, once: after a recovery the host's link to its coprocessor (mvmgmt0) stayed down |
1010 | open: seen once, down |
| a recovery after a quiesce | the host froze in one recovery | 1004 | open: 1 of 8 octep recoveries that day |
| the XGS 136 | the host stopped once under HTTP with a new connection for each response | 1005 | open: 1 of 14 runs |
| the bench, not the XGS 136 | 1006 | closed: a fault of the bench |
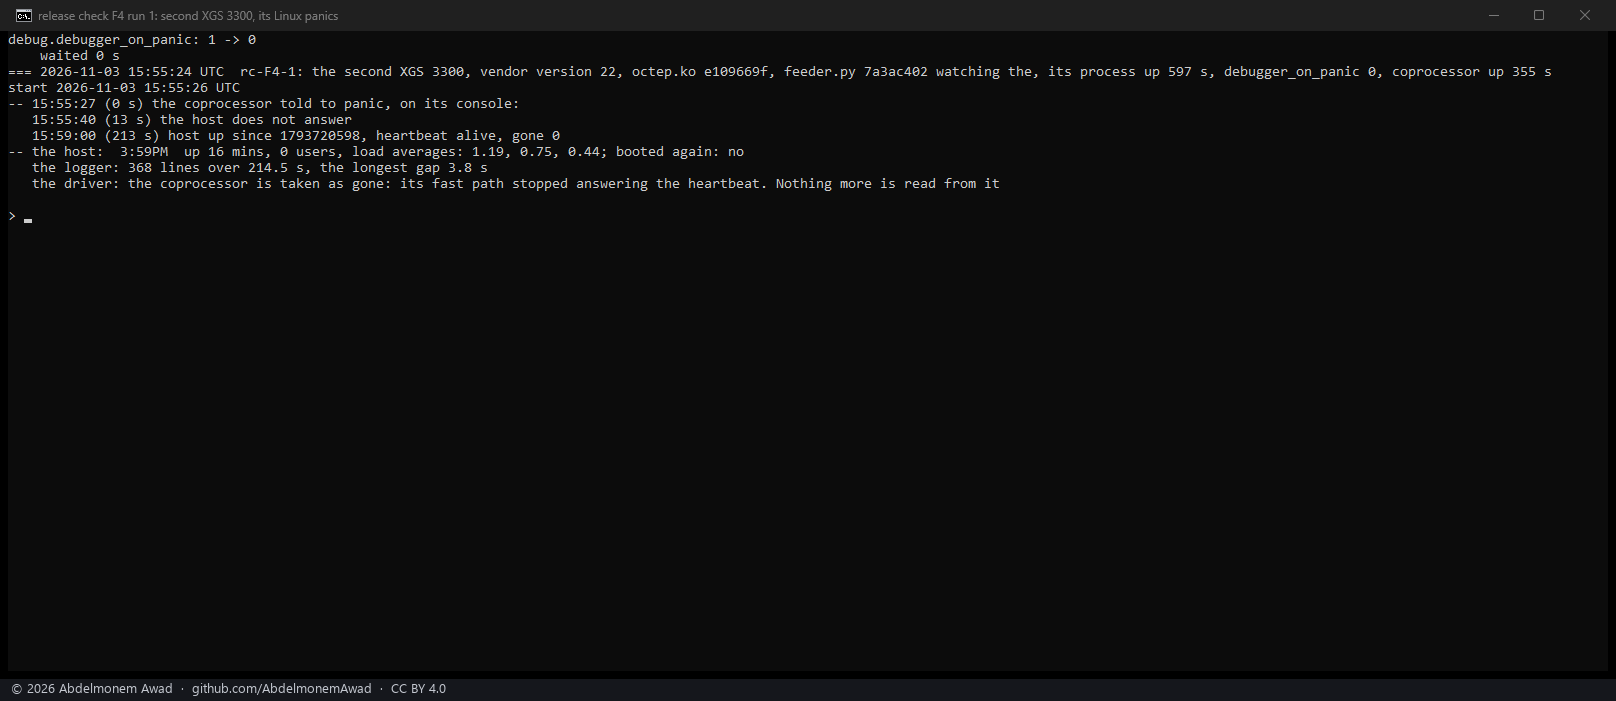
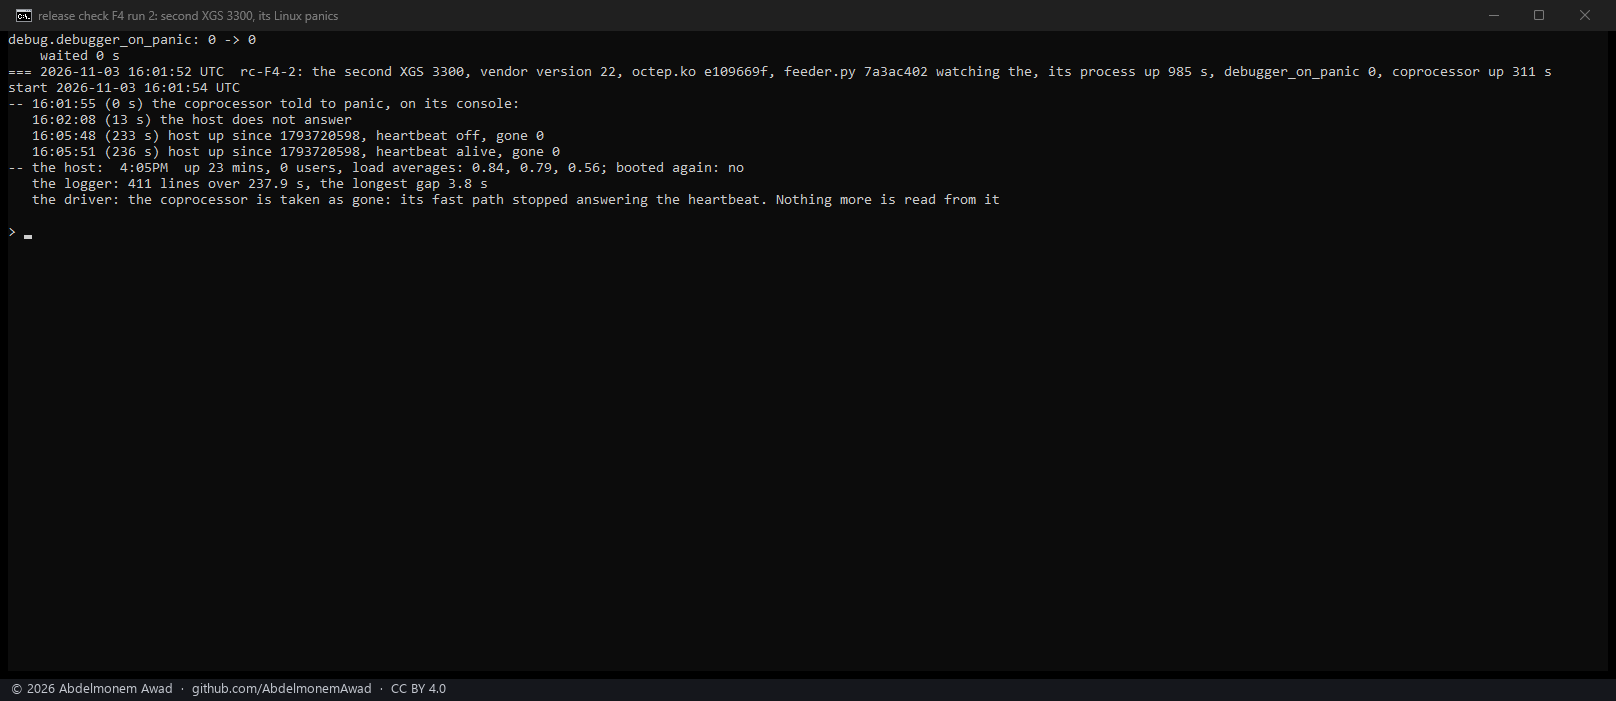
What the candidate brings, measured here: a panic of the coprocessor's Linux on an XGS 3300 did not freeze its host, 2 of 2 (F4); npuep reloaded under the loads that panicked v0.1.0-alpha.12's module on the morning of 2026-11-03 (npuep-unload-panics-2026-11-03) lived 10 of 10, and its recovery 2 of 2 (F1, F2); and no regression in performance on either family (section 3).
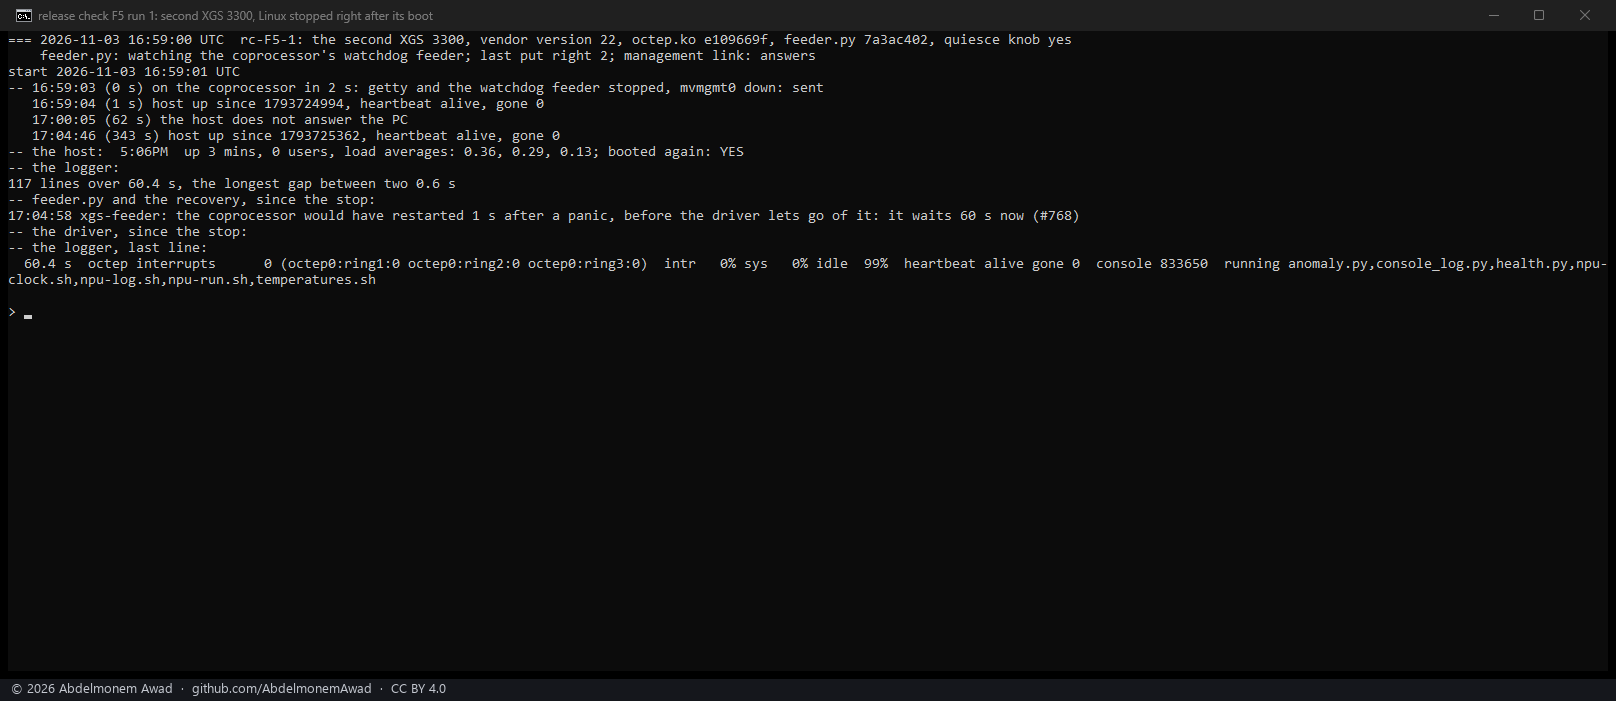
What it leaves, measured: a stop of the coprocessor's Linux in the first two minutes after a boot freezes the host (F5, 2 of 2), and so does a stop of its userland alone, its kernel answering every echo (F6, 1 of 1) - both as the design of 768's watch says, now measured. And, run after the four fixes merged: a stop of its Linux after minutes of slow looks - its sshd not answering - froze the host 2 of 2 with 1008's feeder.py, the stop falling inside a look that blinded the watch for 57 s (1012, F3b again in section 4).
The soak - 5 h 42 min on all three at once, 3,854 passes - lost none; no box restarted and none grew its kernel memory of type devbuf by a byte. On the second XGS 3300, forwarding three loops at about 3.3 Gbit/s each, 53 receive rings were left with packets in them and emptied by the receive watchdog (361, open; section 5).
1. Static checks
| what | result |
|---|---|
CI on 2a000ea |
all 9 workflows passed - checks, CodeQL, Scorecard, the website and the others |
| code scanning alerts open | 0 |
checks.yml run locally |
34 checks: 32 pass on Linux; the 2 that need PHP (test-assign-mgmt, test-firewall-hook) passed in CI on the same commit |
| the build an appliance makes | no warning on any of the three; octep 530,288 bytes, npuep 437,872 bytes |
| reproducible | the modules each appliance's update built are byte for byte the build box's: octep e109669f, npuep d0d9952c |
clang's extra warnings (-Wextra -Wshadow -Wconditional-uninitialized and others) |
none in the lines the candidate changed; 22 in older code, 16 inside FreeBSD's mbuf.h |
| clang's static analyser | not run: the build box's base compiler has none ("action RunAnalysis not compiled in"), and WSL has no clang |
| reviews | three independent reviews of the difference, every finding checked against the code by hand; a third of the fixes themselves changed 1008's first form |
2. The update, as an appliance gets it
XGS: Updates' own steps - update.py channel main, update.py check, then configctl xgs update apply,
which the button runs - on each of the three:
| what | first XGS 3300 | second XGS 3300 | XGS 136 |
|---|---|---|---|
| the update | 2a000ea shown with its eight changes, installed in 43 s |
the same, 47 s | the same, 41 s |
| warnings in the update's build | 0 | 0 | 0 |
| "nothing waits for a reboot" | yes - the module built is the one loaded | yes | yes |
config.xml |
not written | not written | saved again with the same content, a revision more ("mvmgmt0 assigned as opt15") |
install/verify.sh after a boot |
exit 0: 8 passed, 0 failed | exit 0: 8, 0 | exit 0: 13, 0 |
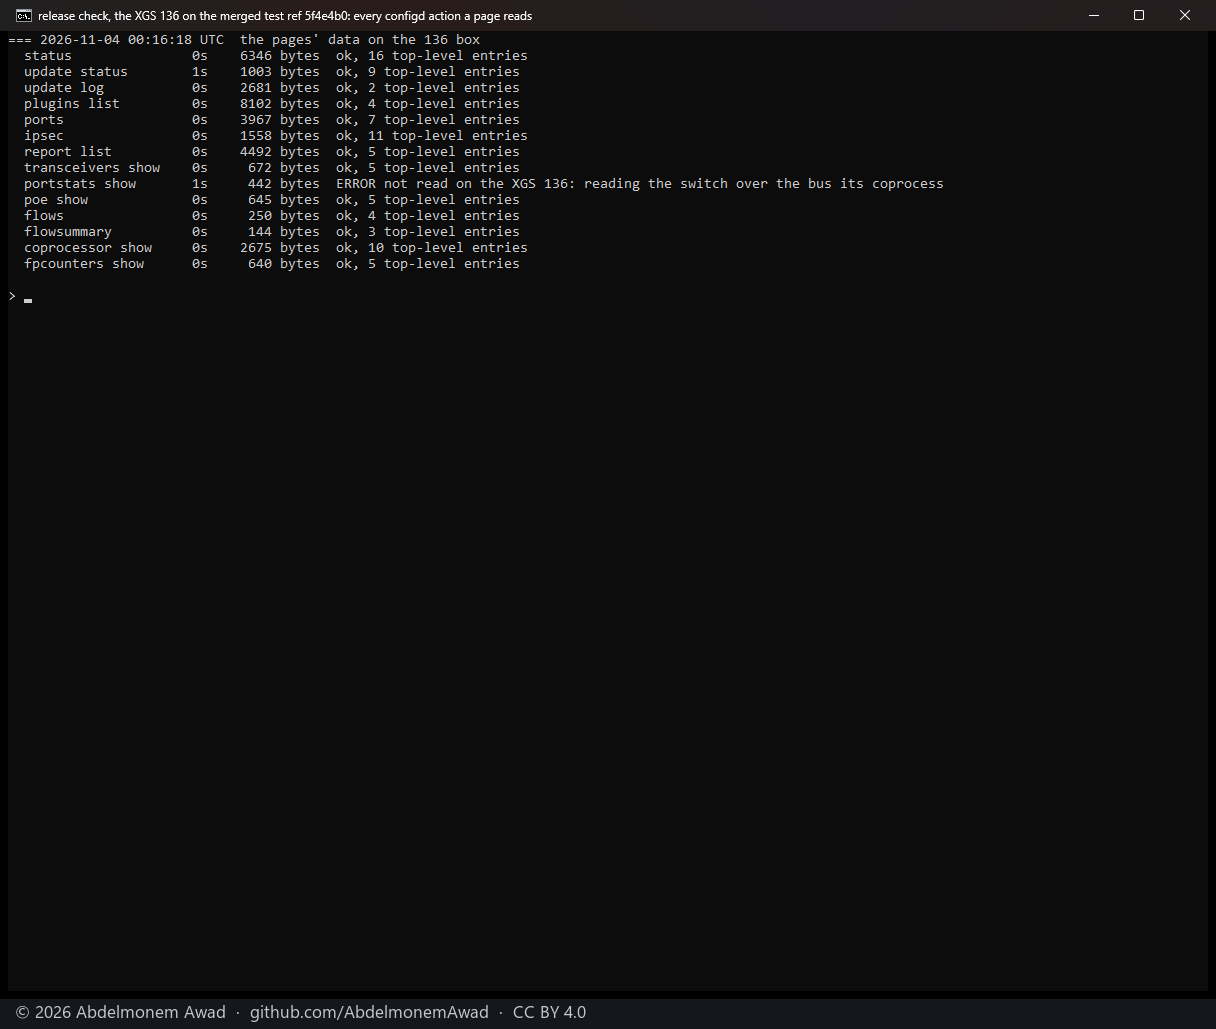
| the 14 configd actions the XGS pages read | all valid JSON, no error | all valid | 12 valid; portstats not read on the XGS 136 on purpose (639); poe "console busy" twice of three - a look of feeder.py held the console - and valid the third time, 17 s on |
On the XGS 136 every update that changes nothing in config.xml still saves it again, and so adds a
revision. RELEASING.md's two checks of octep's stop and detach ran on the second XGS 3300 (F8, section 4).
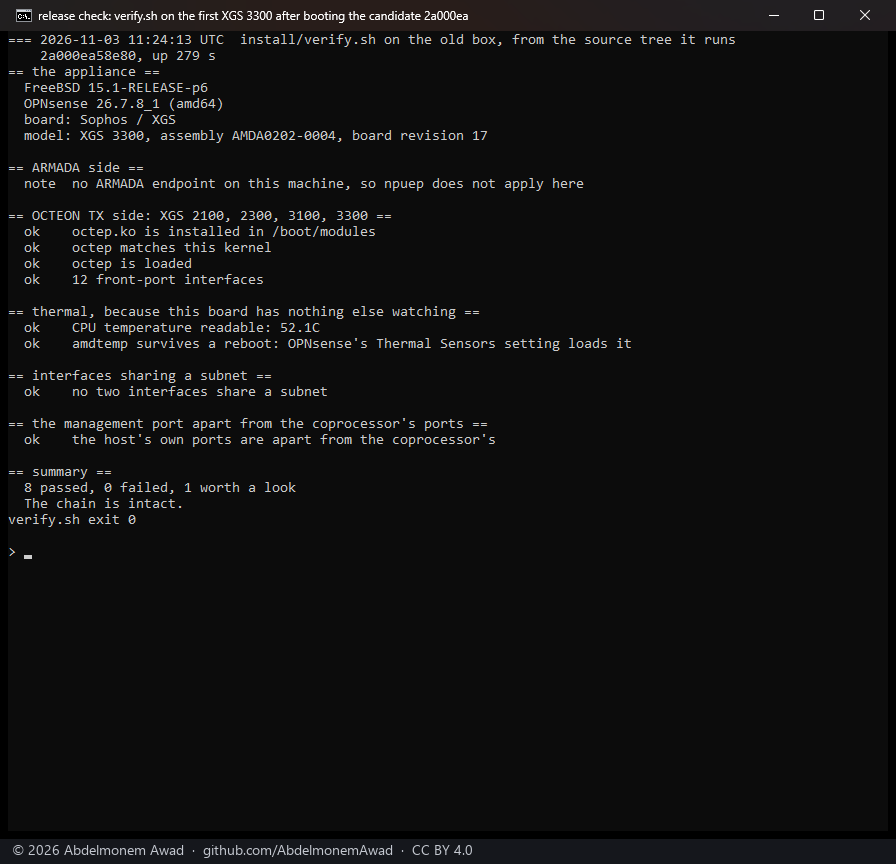
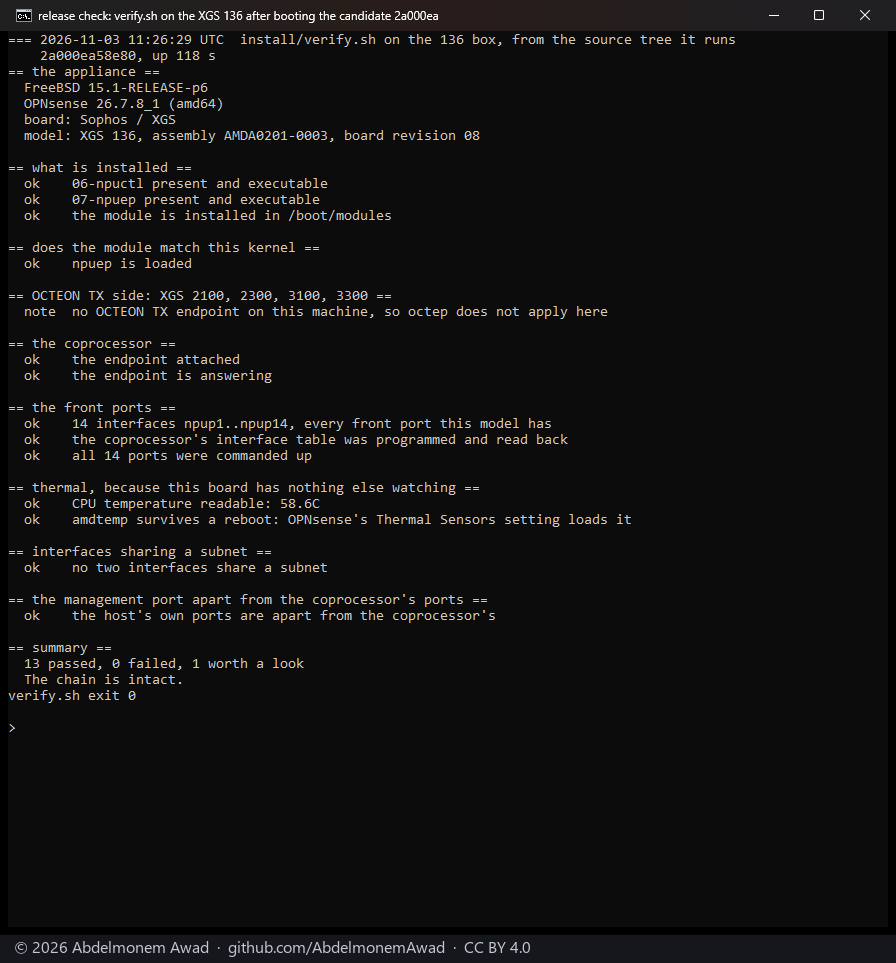
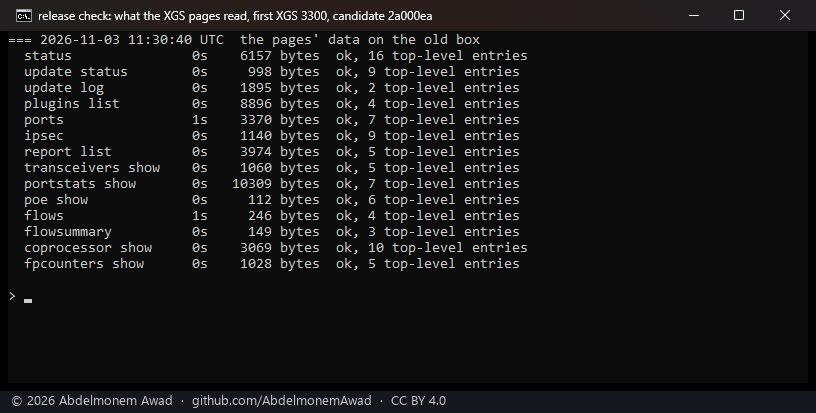
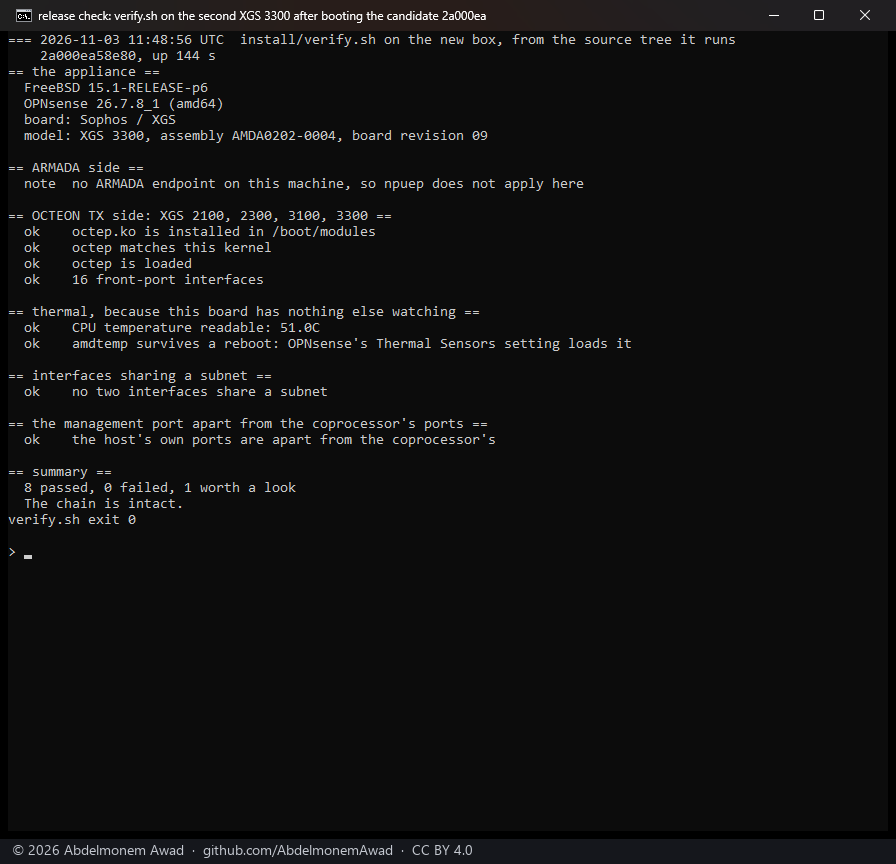
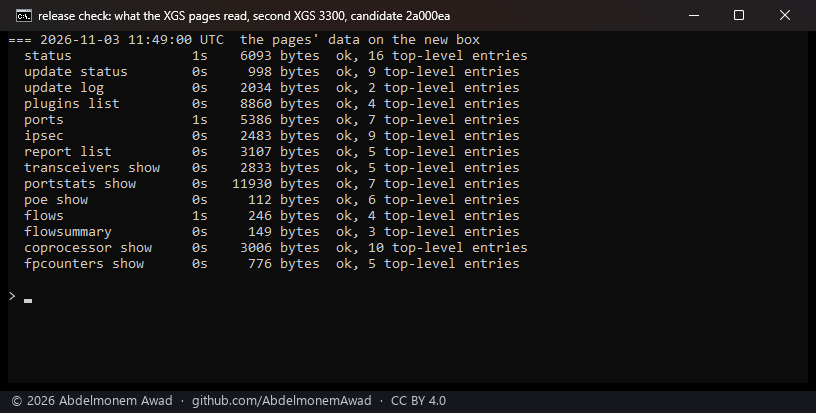
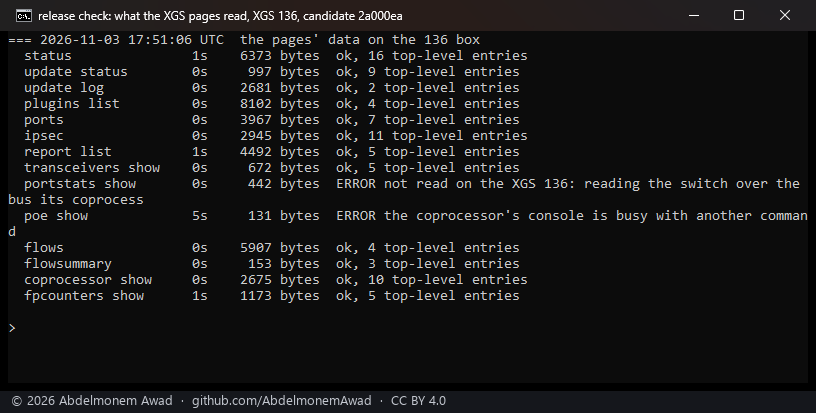
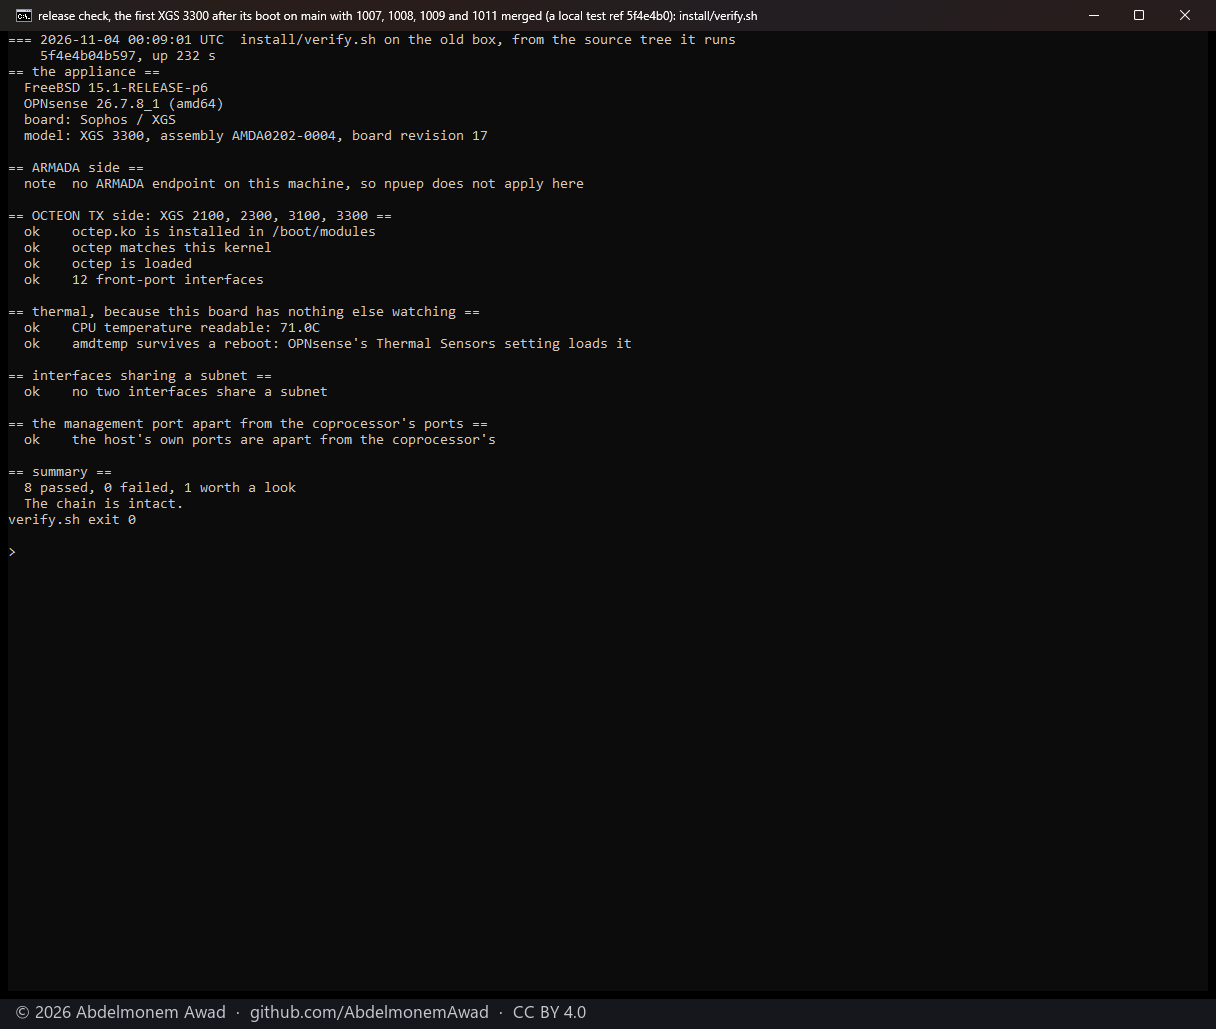
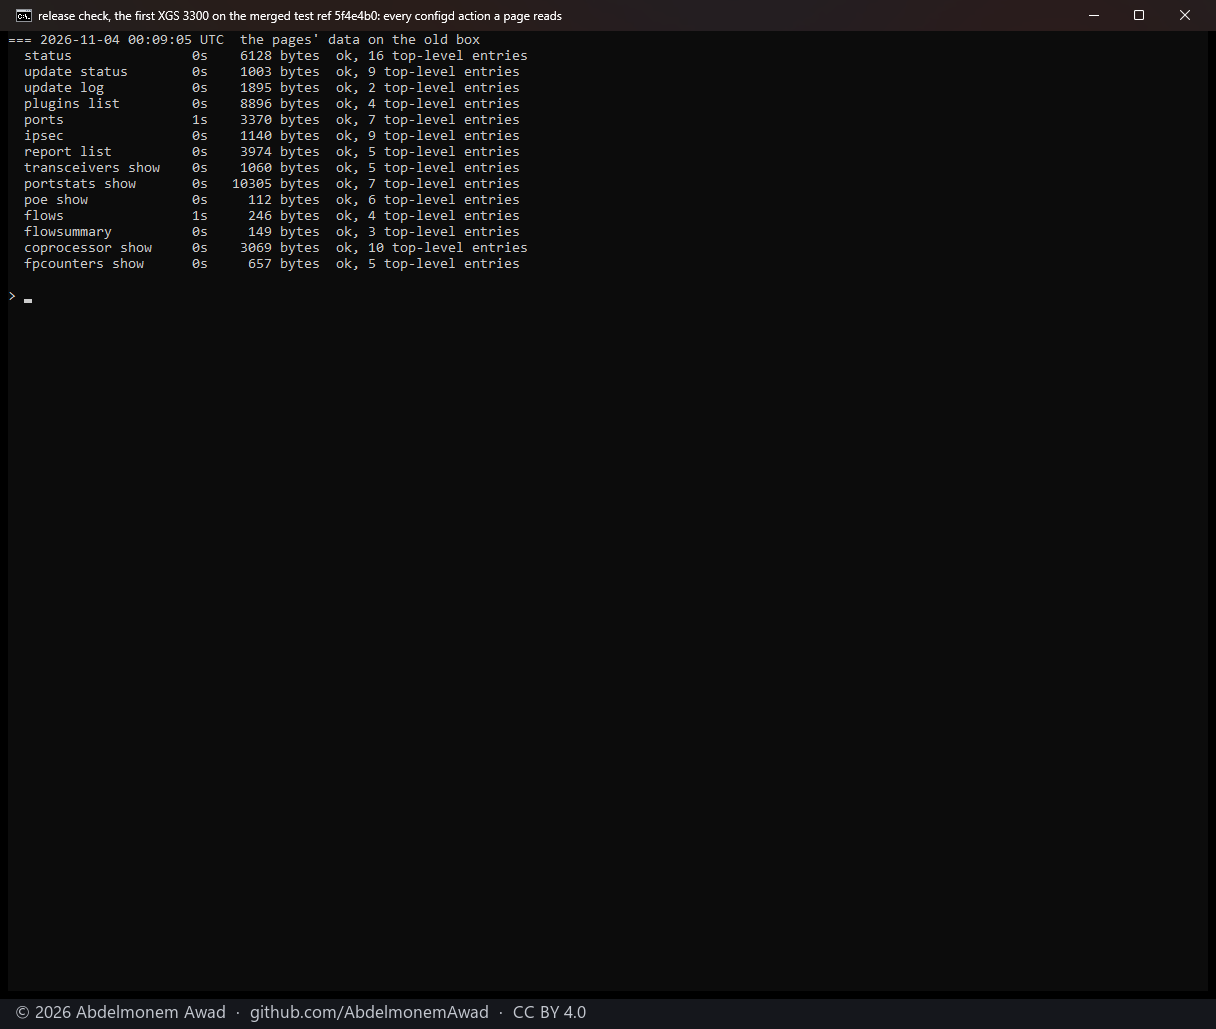
The fixes, merged, as an update brings them (2026-11-04, 00:03-00:18). Main with
1007,
1008,
1009 and
1011 merged - a local commit, 5f4e4b0,
made only for this, no conflict among them - installed by its own install/install.sh as the update
runs it, on the first XGS 3300 and the XGS 136, each restarted after:
| what | first XGS 3300 | XGS 136 |
|---|---|---|
| install.sh | exit 0 in 30 s, no warning | exit 0 in 30 s, no warning |
| the module the appliance built | octep 71a6c3f0, the new description of look_pba_down in it |
npuep 4780b80e, byte for byte the module run in F10 and in F1 again (section 4) |
feeder.py |
b09fdad5 (1008), watching |
the same, watching |
install/verify.sh after the boot |
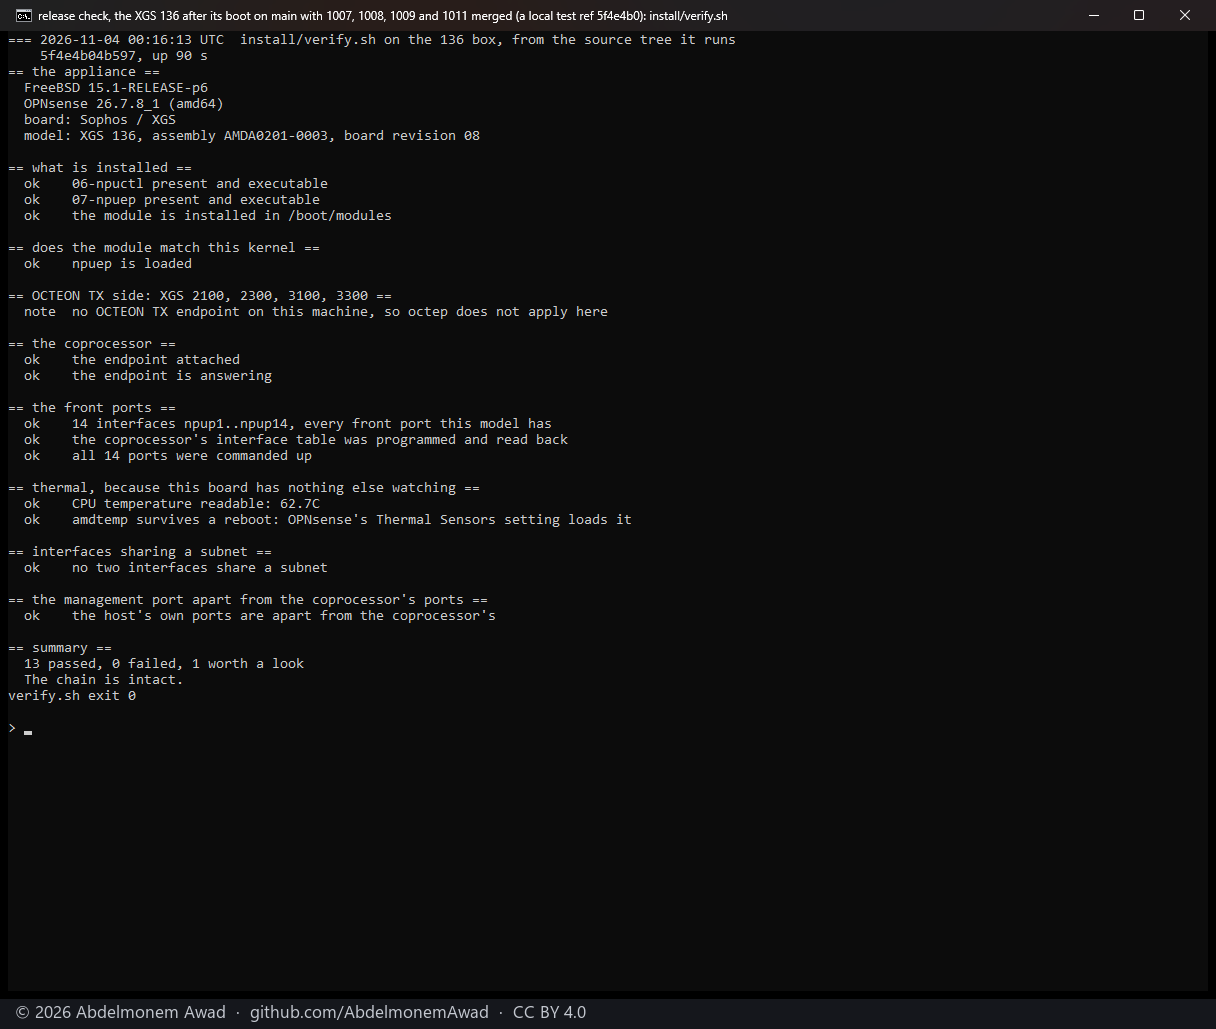
exit 0: 8 passed, 0 failed | exit 0: 13 passed, 0 failed |
| the 14 configd actions the pages read | all valid, no error | 13 valid; portstats not read on purpose (639) |
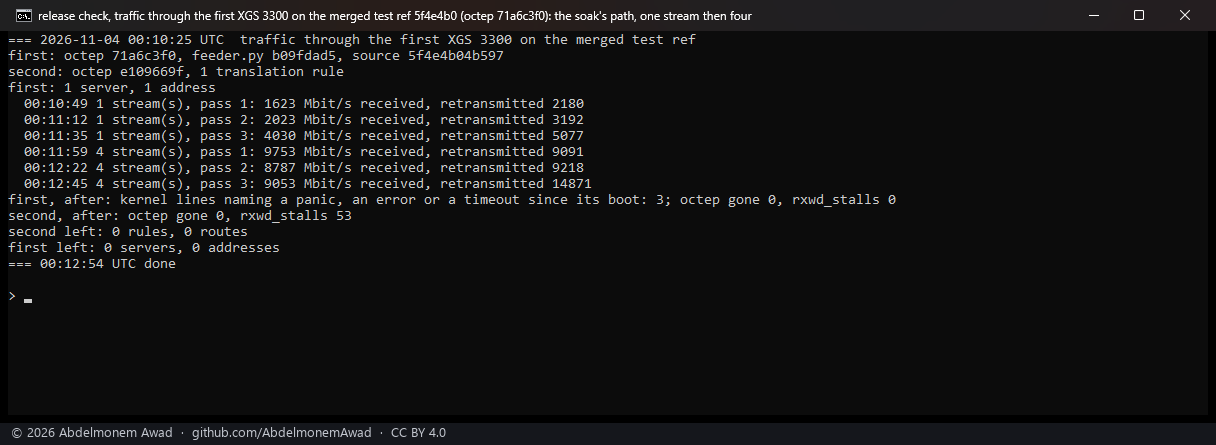
| traffic | the soak's path from it through the second XGS 3300: one stream 1,623, 2,023 and 4,030 Mbit/s, four 9,753, 8,787 and 9,053, no error | its link to its coprocessor up at the boot, the heartbeat alive |
1009's description gave its build as 4fccf671: that build was of an earlier state of octep_dp.c,
three lines shorter where the module's lock calls carry their line numbers - 11 such numbers, and the
build's id, are the only bytes that differ. Its commit builds as 71a6c3f0.
3. Performance, A against B
Each arm was installed once the way an appliance gets it - B by XGS: Updates, A by v0.1.0-alpha.12's
own installer - and its four files were kept on the box and put back before each series, with a
restart. The order was B, A, B, A on the XGS 136 (boots at 11:24, 12:09, 12:29 and 13:16) and B, A, B on
the second XGS 3300 (11:46, 12:53 and 13:37); the other box stayed on B. A series: 300 s idle; iperf3
three times for each kind, 10 s each, from the PC on the XGS 136's LAN to the second XGS 3300 behind
its Port8; the round trip by 200 UDP probes, idle and under load; on the XGS 136, HTTP of 512 KiB
responses over 1,024 connections, a new connection for each response or the connections kept open; on
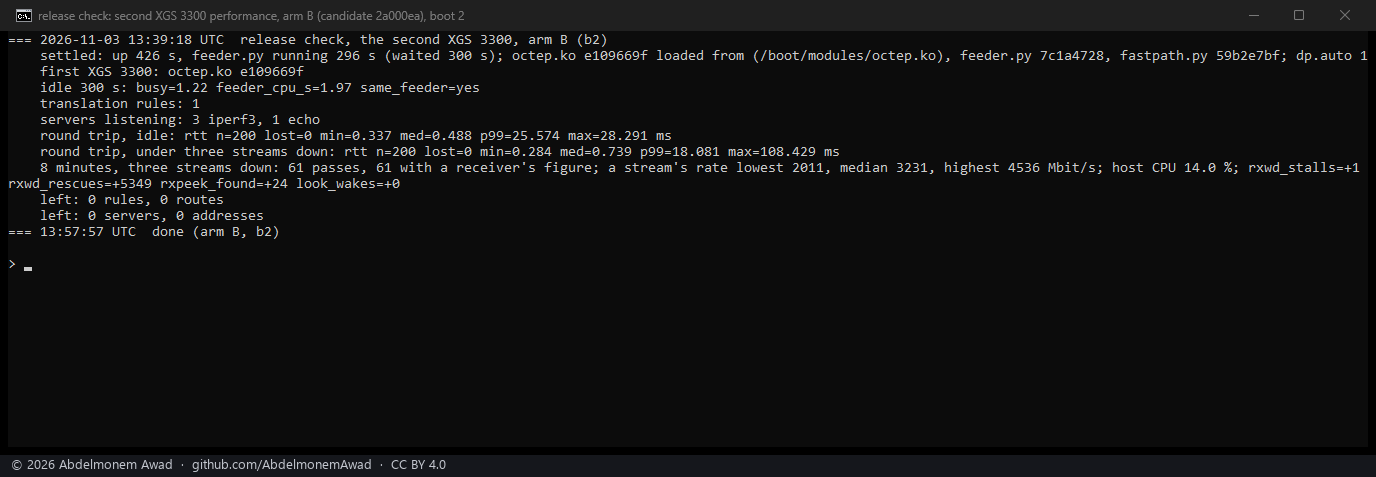
the second XGS 3300, eight minutes of three iperf3 loops through its translation and fast path. The
figures are medians with their range and count, and an exact Mann-Whitney U test (a normal
approximation where marked ~). images/deploy/rc-ab-report.py made the tables from the series' logs.
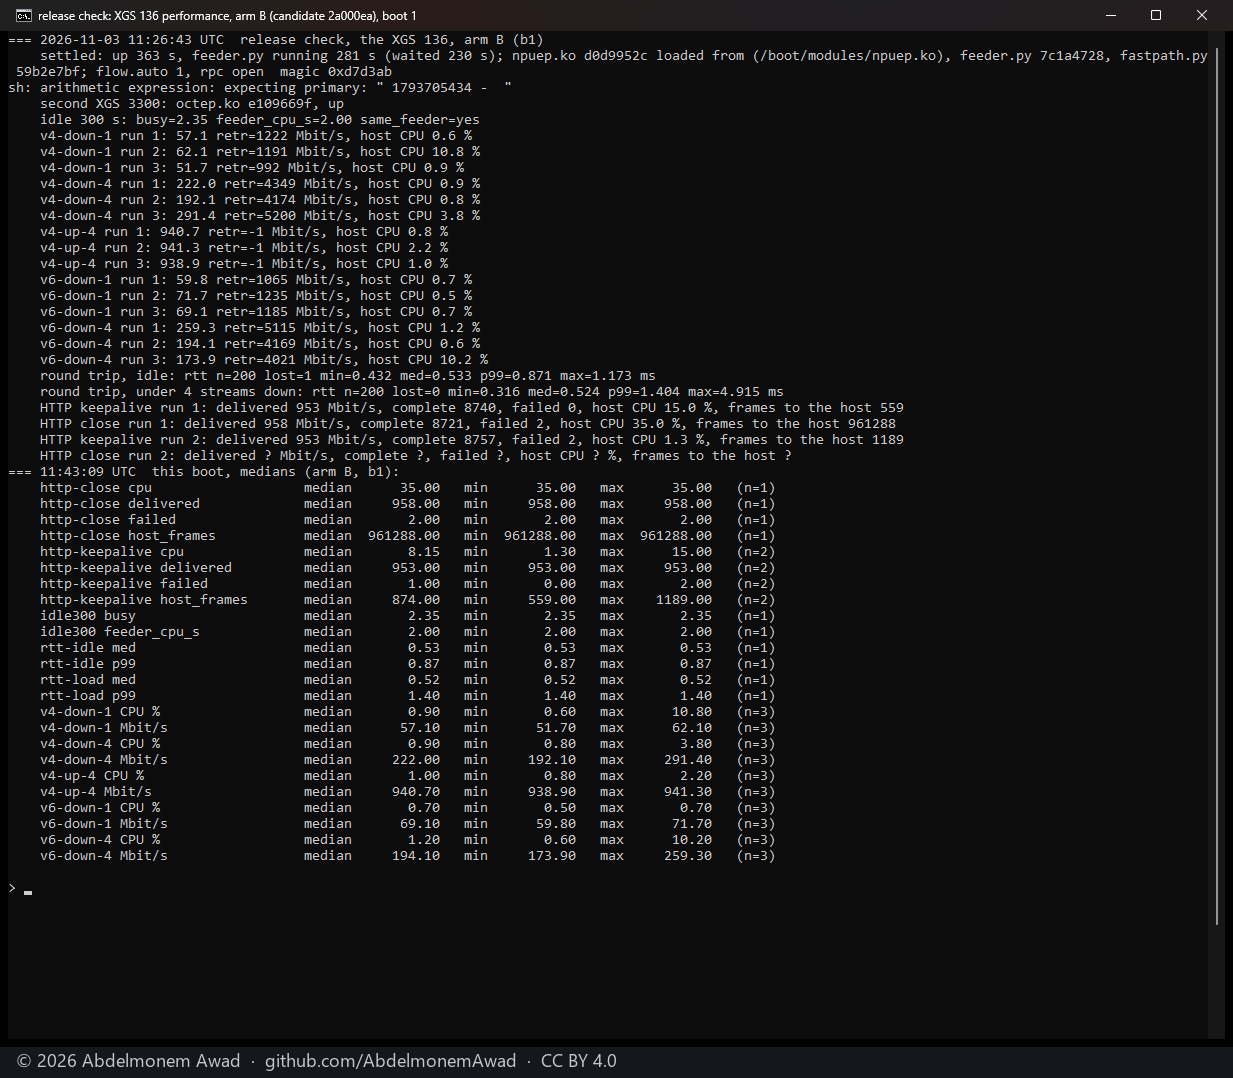
The XGS 136 - its streams from the PC's card on its Port3, a bench link with a record of faults; its download rows measure that link's state in each boot more than the 136 (below, and 1006):
| figure | A | B | B against A | p |
|---|---|---|---|---|
| one stream down, IPv4, Mbit/s | 289 [106-533], 6 | 253 [52-552], 6 | -12.6 % | 0.59 |
| its retransmissions | 1,600 [1,332-2,036] | 1,429 [992-1,955] | -10.7 % | 0.49 |
| four streams down, IPv4 | 711 [430-928], 6 | 600 [192-927], 6 | -15.7 % | 0.39 |
| four streams up, IPv4 | 941.3 [935.1-941.6], 6 | 940.7 [928.6-941.4], 6 | -0.1 % | 0.29 |
| one stream down, IPv6 | 287 [146-452], 6 | 268 [60-535], 6 | -6.7 % | 1.00 |
| four streams down, IPv6 | 653 [376-908], 6 | 564 [174-917], 6 | -13.6 % | 0.39 |
| HTTP, a connection for each response, Mbit/s delivered | 969 [963-979], 4 | 975 [958-980], 3 | +0.6 % | 0.86 |
| its frames that reached the host | 947,497 [932,106-959,182] | 984,532 [961,288-1,013,026] | +3.9 % | 0.057 |
| its host CPU, % | 27.4 [25.1-38.8] | 25.2 [25.0-35.0] | -7.9 % | 0.63 |
| HTTP, connections kept open, Mbit/s delivered | 972 [966-981], 4 | 965 [953-979], 4 | -0.7 % | 0.60 |
| its responses failed | 1 [0-5] | 1 [0-48] | 1.00 | |
| host CPU idle over 300 s, % | 2.29 [2.27-2.30], 2 | 2.36 [2.35-2.37], 2 | +3.3 % | 0.33 |
| feeder.py's CPU time in those 300 s, s | 1.58 [1.58-1.59] | 2.01 [2.00-2.03] | +27 % | 0.33 |
| round trip idle, median, ms | 0.55 [0.54-0.56], 2 | 0.54 [0.53-0.54], 2 | -2.7 % | 0.33 |
| round trip idle, 99th percentile, ms | 6.12 [2.15-10.09] | 1.17 [0.87-1.46] | 0.33 | |
| round trip under load, median, ms | 0.63 [0.51-0.75] | 0.70 [0.52-0.88] | +11 % | 0.67 |
| round trip under load, 99th percentile, ms | 1.59 [1.44-1.73] | 13.93 [1.40-26.45] | 1.00 |
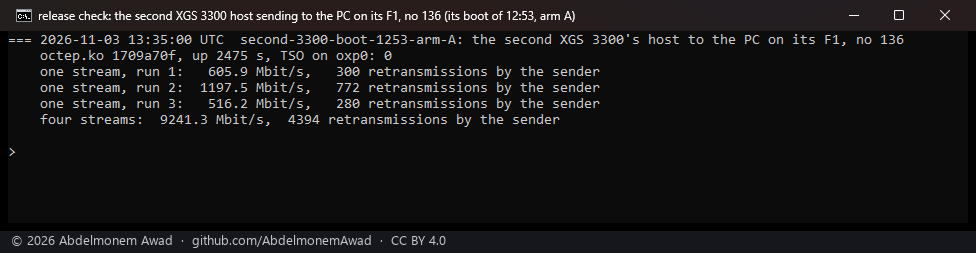
- The downloads follow the boot, not the arm. One stream's median per boot: 57 Mbit/s in B's
first, 523 in A's first, 509 in B's second and 107 in A's second - a slow boot in each arm. The sender
was not slow (photo 15), and uploads and HTTP ran at the line's rate in every boot.
1006 has the figures. The retransmitted
share of the segments held steady within a boot whatever the streams' number or rate: 1.99-2.68 % and
1.22-1.72 % in the slow boots, 0.34-0.63 % and 0.41-0.61 % in the fast ones, 0.06-0.08 % with no XGS
136 between. And in the soak's boot, a slow one, the PC's card on the 136's LAN counted receive errors
on 2.0 % of its frames: frames lost on the copper link from Port3 to the PC, or at one of its ends -
not yet read in a fast boot.and in that same boot the same download from the PC's other card on the 136's F1 ran at 937, 940 and 945 Mbit/s, that card counting no receive error. So the slow boots were the Port3 link's, not the 136's nor either version's - a fault of the bench, and the download rows above do not compare the two versions. The uploads, HTTP, CPU and round-trip rows ran at the line's rate or beside it in every boot. - HTTP with a new connection for each response stopped the XGS 136's host once, in B's first boot: its run is not in the table (1005).
- The round trip's 99th percentile is the second-highest of 200 probes. One run in an arm had a high one: A's second boot idle (10.09 ms), B's second boot under load (26.45 ms, its highest probe 50 ms). With two runs a side, neither is a difference; one of B's runs with the connections kept open had 48 of 9,070 responses fail.
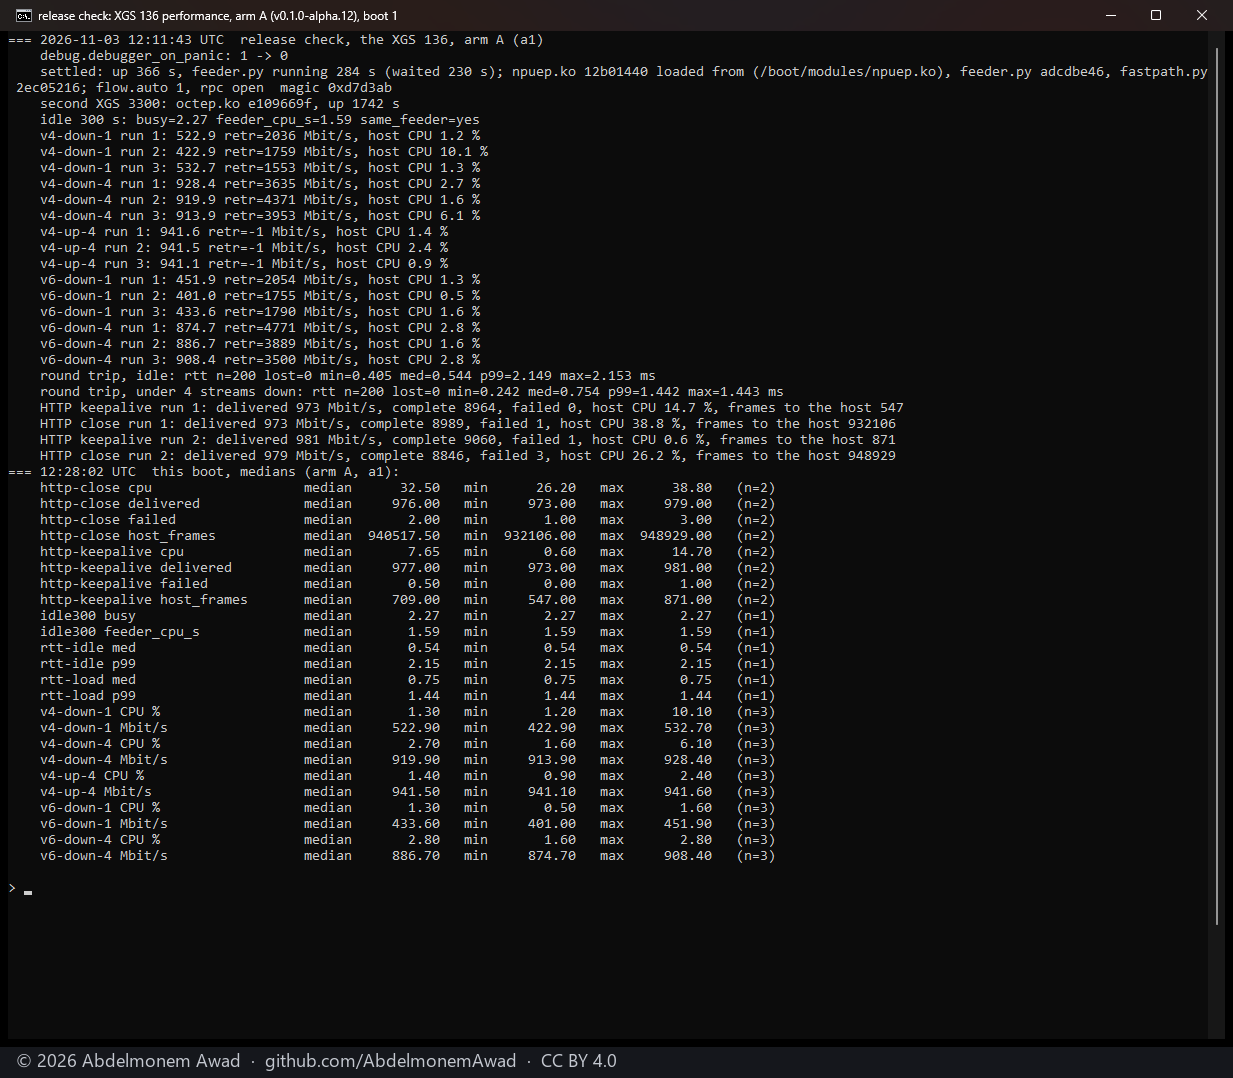
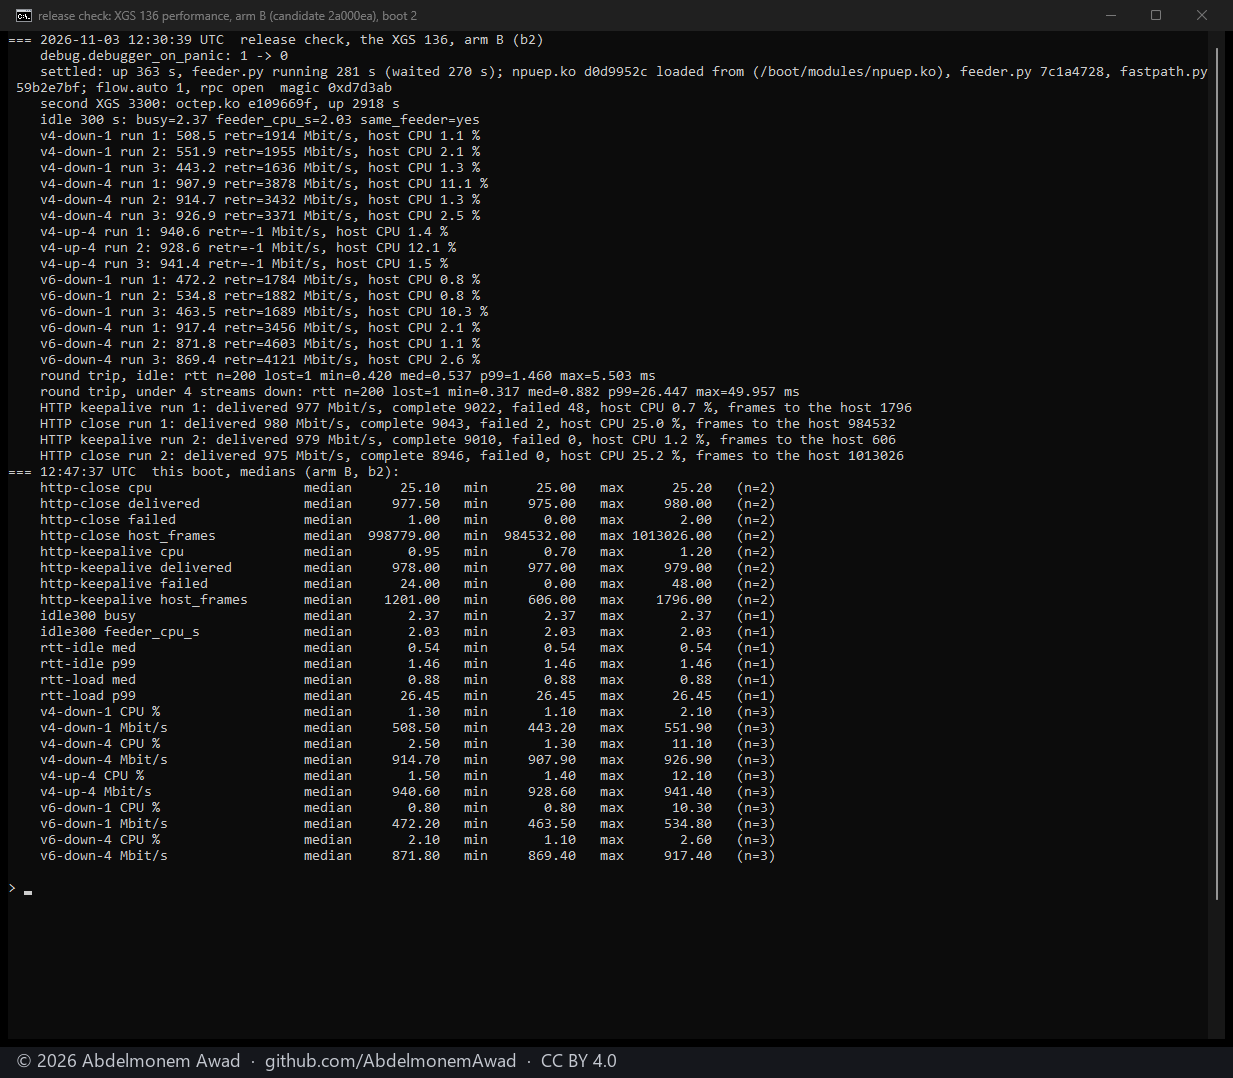
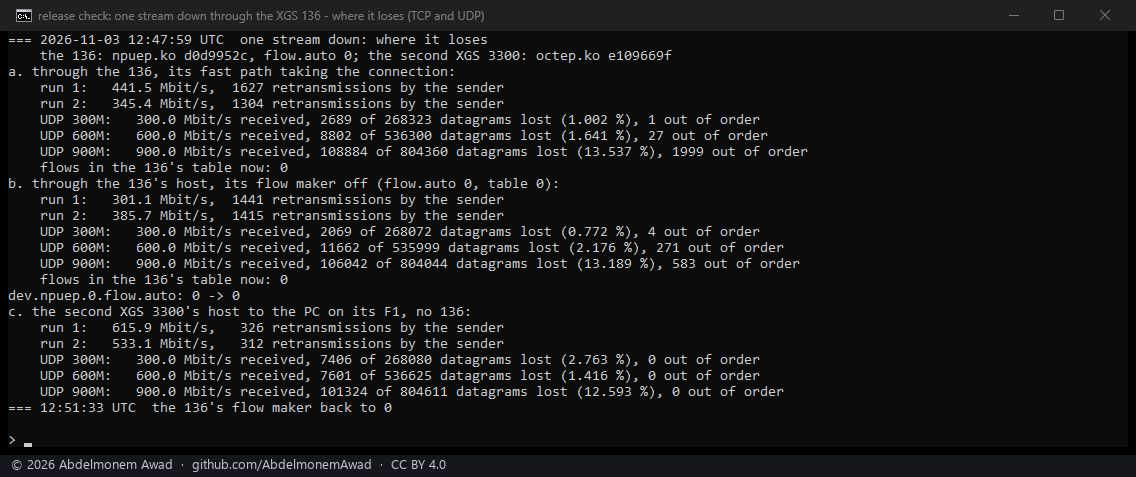
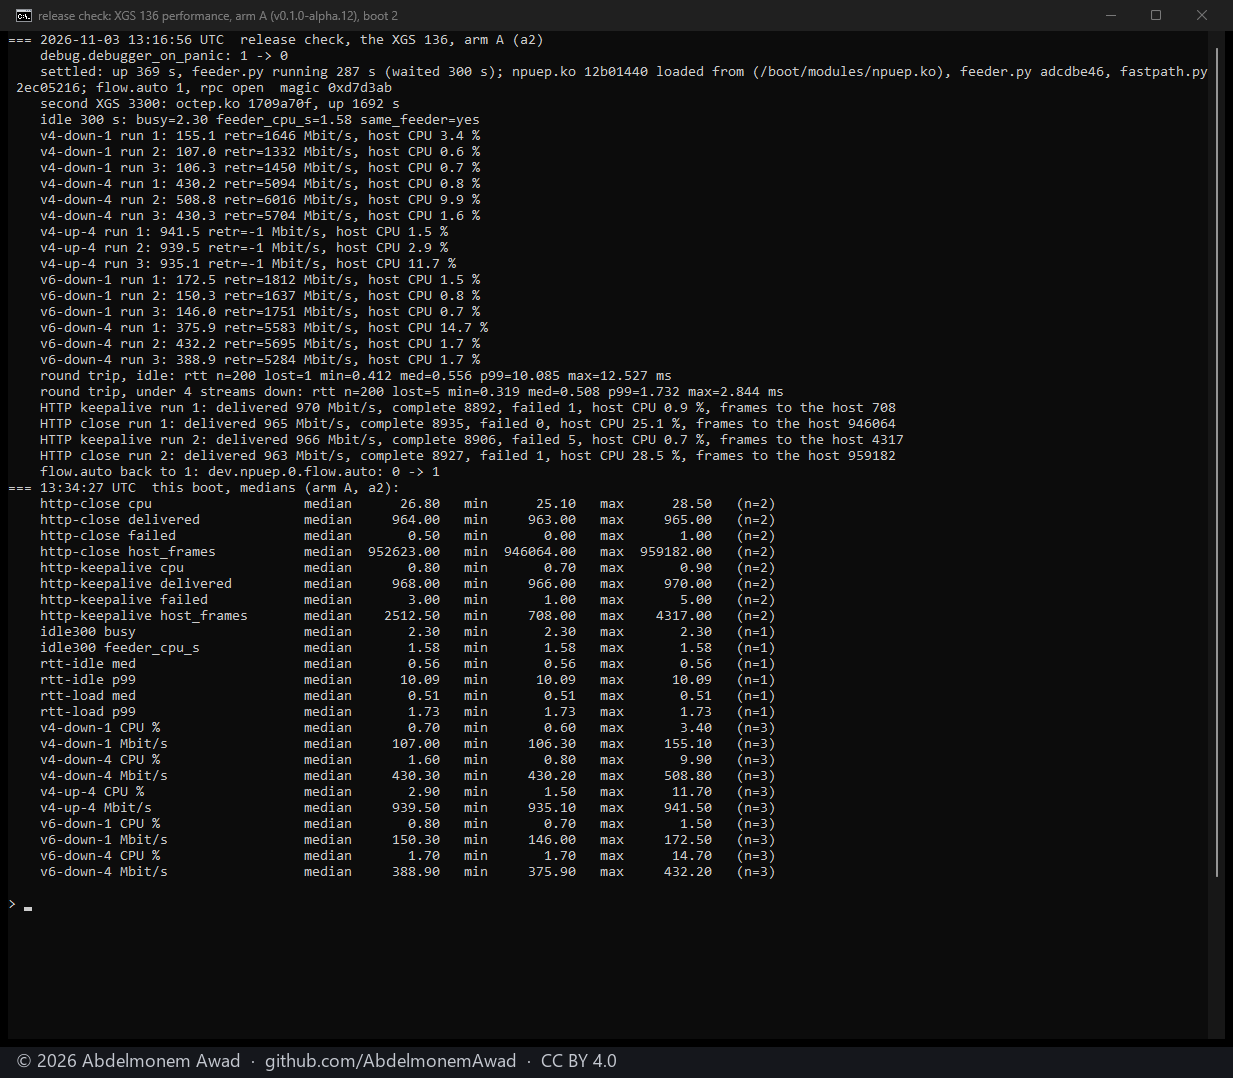
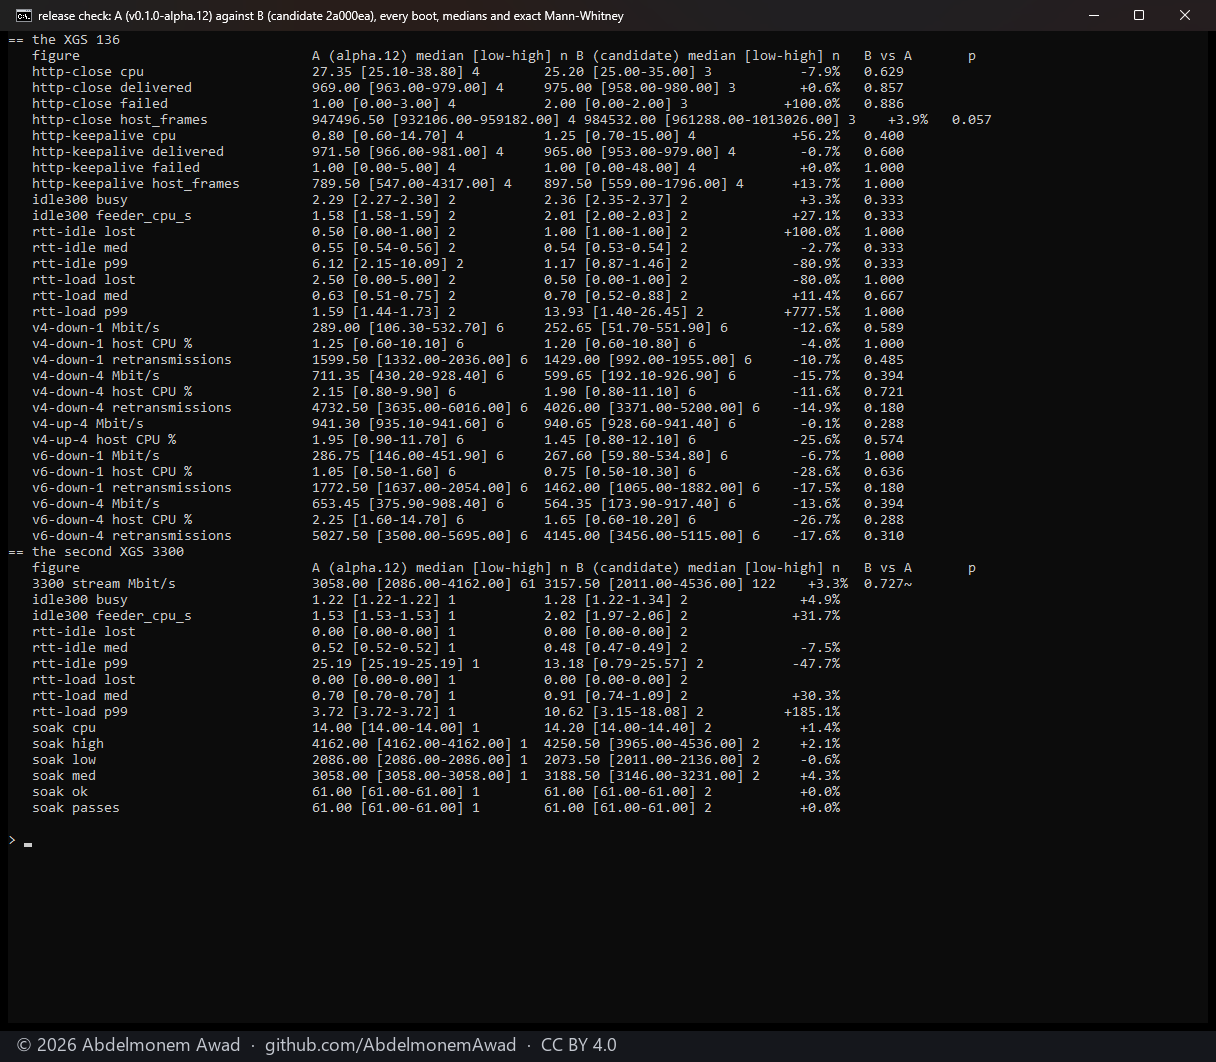
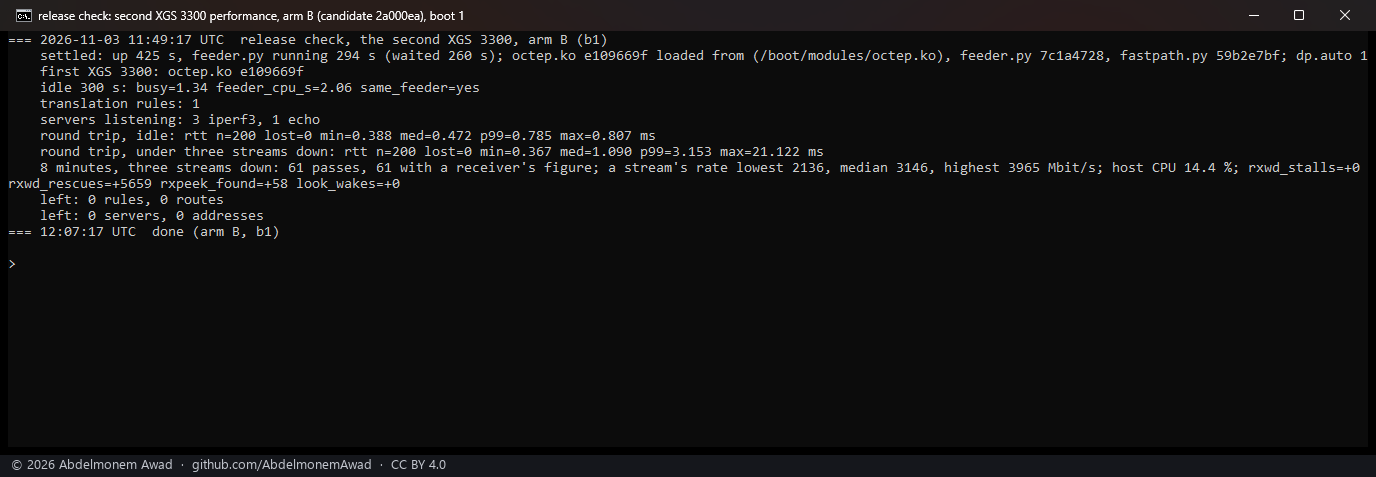
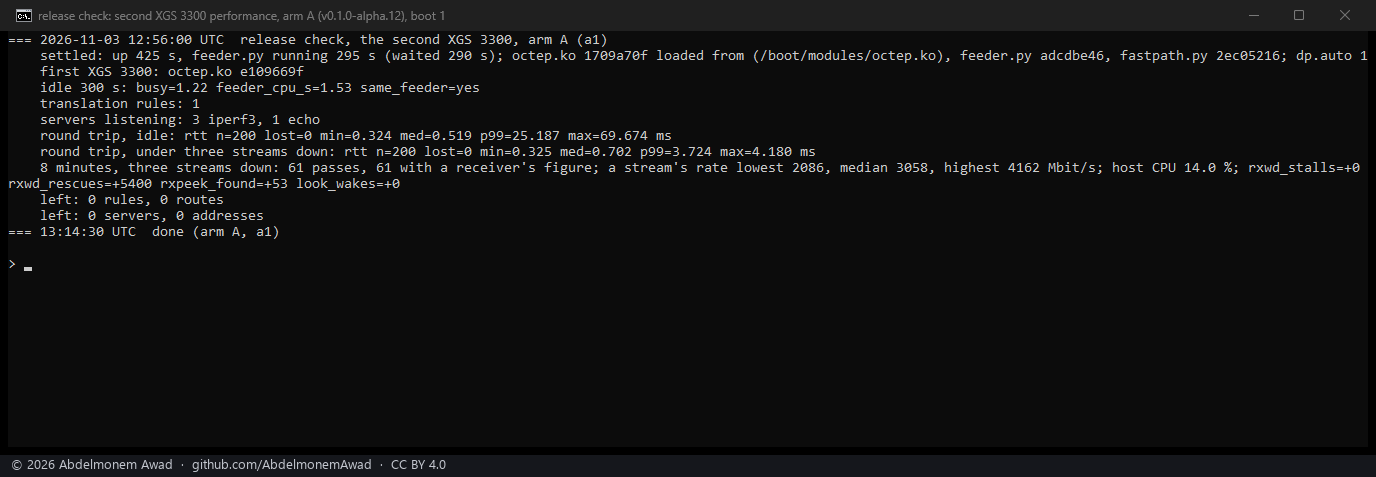
The second XGS 3300 (two figures in B: its first boot, then its second):
| figure | A | B | B against A | p |
|---|---|---|---|---|
| a stream in the 8-minute soak, Mbit/s | 3,058 [2,086-4,162], 61 | 3,158 [2,011-4,536], 122 | +3.3 % | 0.73~ |
| the soak's passes that delivered | 61 of 61 | 122 of 122 | ||
| host CPU in the soak, % | 14.0 | 14.4 and 14.0 | ||
rings stalled in the soak (rxwd_stalls) |
0 | 0 and 1, the known stall of 361 | ||
| host CPU idle over 300 s, % | 1.22 | 1.34 and 1.22 | ||
| feeder.py's CPU time in those 300 s, s | 1.53 | 2.06 and 1.97 | +32 % | |
| round trip idle, median, ms | 0.52 | 0.47 and 0.49 | ||
| round trip idle, 99th percentile, ms | 25.19 | 0.79 and 25.57 | ||
| round trip under load, median, ms | 0.70 | 1.09 and 0.74 | ||
| round trip under load, 99th percentile, ms | 3.72 | 3.15 and 18.08 |
B's first idle figure (1.34 %) holds the XGS 136's restart at 11:53-11:55, which took the lab link down and up within those 300 s; it is shown, not compared.
No regression that belongs to the candidate was found on either box - on the XGS 136 outside its download rows, which measured the bench's Port3 link. The one steady cost: about half a second of CPU in five minutes for feeder.py's watch of the management link - 0.43 s on the XGS 136, 0.49 s on the XGS 3300, about 0.15 % of one core. Nearest to a difference: the frames that reached the XGS 136's host in HTTP with a new connection for each response, +3.9 % in B at p = 0.057, three runs against four - not a difference at that count; none of the candidate's changes is in the packets' path as it runs by default.
4. Faults made on purpose
The stop of 768: the coprocessor's getty and
watchdog feeder stopped and its end of the management link taken down, so that its own watchdog resets it
about a minute later (images/deploy/lab-768-silent.sh). On the second XGS 3300 IPsec associations were
up, so its recoveries detach and attach the device with the driver loaded. The plan written before the
runs had F3 five times and F4 and F7 three times each; they ran three, two and two times.
| run | box | what | runs | result |
|---|---|---|---|---|
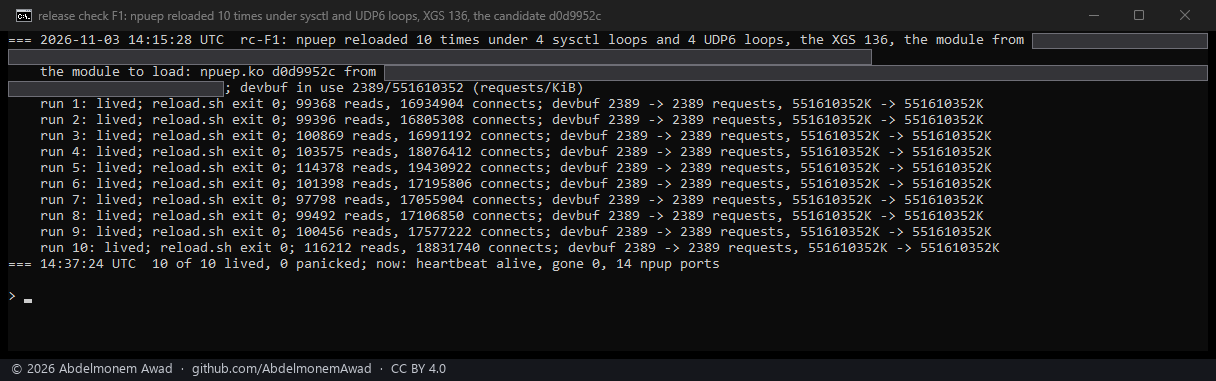
| F1 | XGS 136 | npuep reloaded (contrib/npuep/reload.sh) under four loops reading its sysctls and four connecting UDP over IPv6 |
10 | 10 of 10 lived, reload.sh exit 0 each time, 97,798-116,212 sysctl reads and 16.8-19.4 million connects a run; kernel memory of type devbuf the same before and after every run: 2,389 allocations, 551,610,352 bytes |
| F1, 1007 | XGS 136 | the same with 1007's npuep 4780b80e, after the soak |
3 | 3 of 3 lived, reload.sh exit 0 each time, 98,072-99,115 sysctl reads and 16.99-17.27 million connects a run; devbuf the same before and after every run: 6,629 allocations, 560,351,632 bytes; the host's link to its coprocessor back after each |
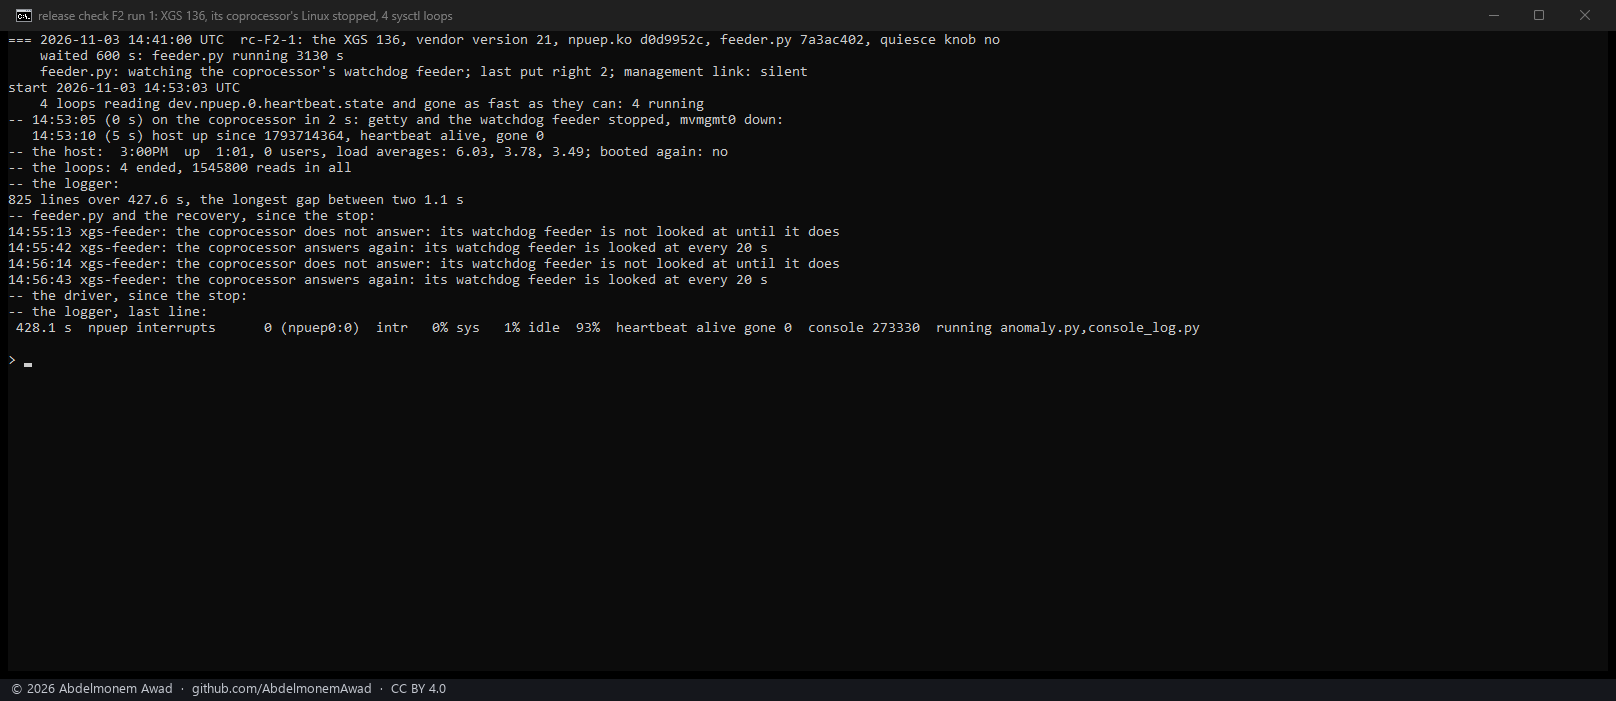
| F2 | XGS 136 | 768's stop, fastpath.py's recovery under four loops reading sysctls | 2 valid | taken as gone after 58-60 s, taken up in place in 90 and 99 s, the host never restarted, no panic under 1.49 million sysctl reads |
| F9 | XGS 136 | HTTP, 512 KiB, 1,024 connections, a new one for each response, pf's states flushed first (1005) | 6 | 6 of 6 lived; 553, then 954-963 Mbit/s delivered; 1 response of about 51,000 failed |
| F10 | XGS 136 | devctl detach npuep0 (1000) |
1 + 1 | the candidate: a panic; 1007's module: detached, the host up |
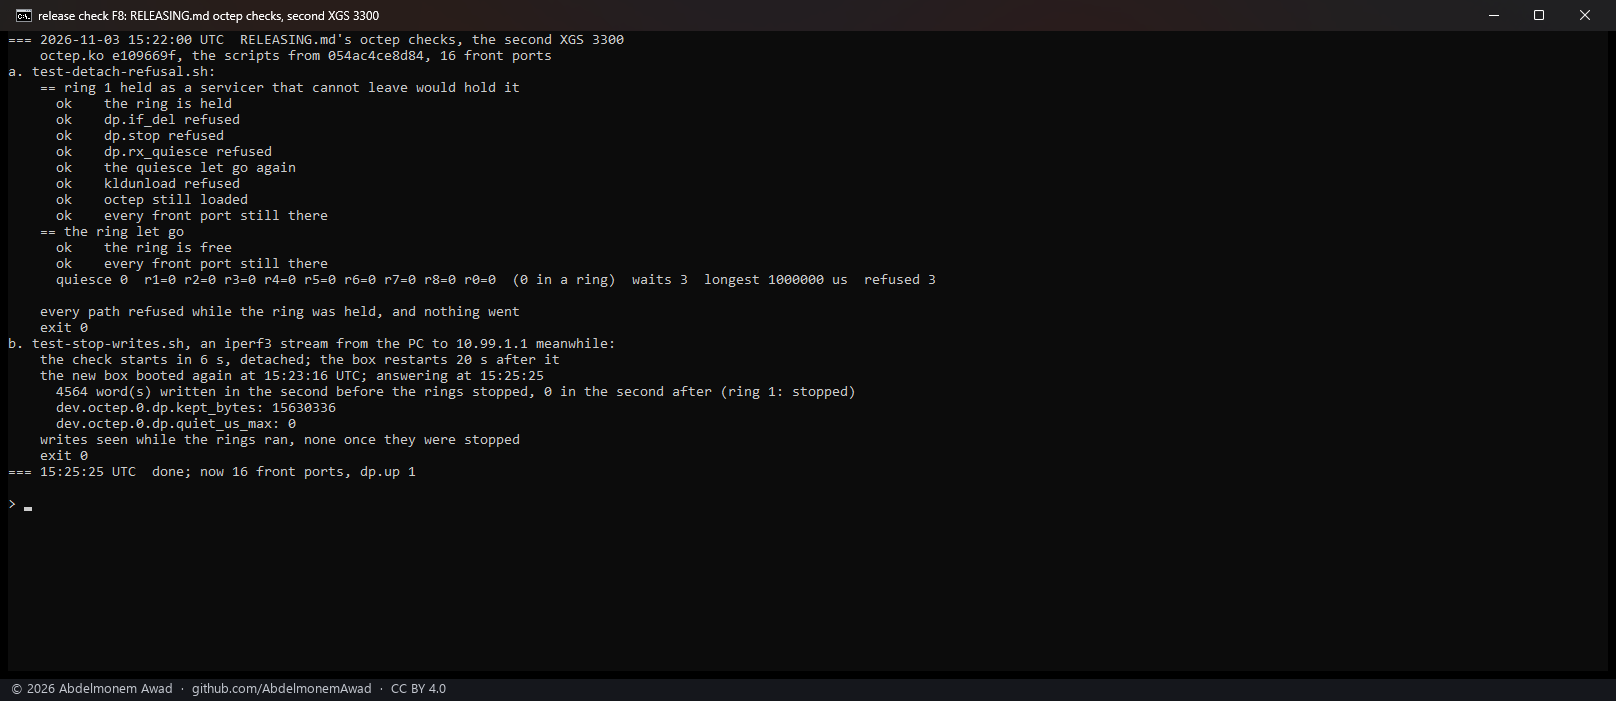
| F8 | second XGS 3300 | RELEASING.md's checks after a change to octep's stop and detach, under a stream | 1 each | test-detach-refusal.sh: every path refused while a ring is held (if_del, stop, rx_quiesce, kldunload), the 16 ports kept, exit 0; test-stop-writes.sh: 4,564 words written a second before the stop, 0 after, exit 0 |
| F3 | second XGS 3300 | 768's stop, the watch steady, main's feeder.py | 3 | 1 of 3 kept the host up. 1: quiesced 39 s after the stop, then the host froze in the recovery (1004). 2: no quiesce before the reset, the host froze (1001). 3: quiesced 39 s after the stop, taken up in place in 172 s. SysRq keys after the quiesce in 1 and 3 (1003) |
| F3, fixed | second XGS 3300 | the same with 1008's feeder.py | 2 | 2 of 2 kept the host up: the driver told 39 and 37 s after the stop, no keys sent, taken up in place in 176 and 178 s |
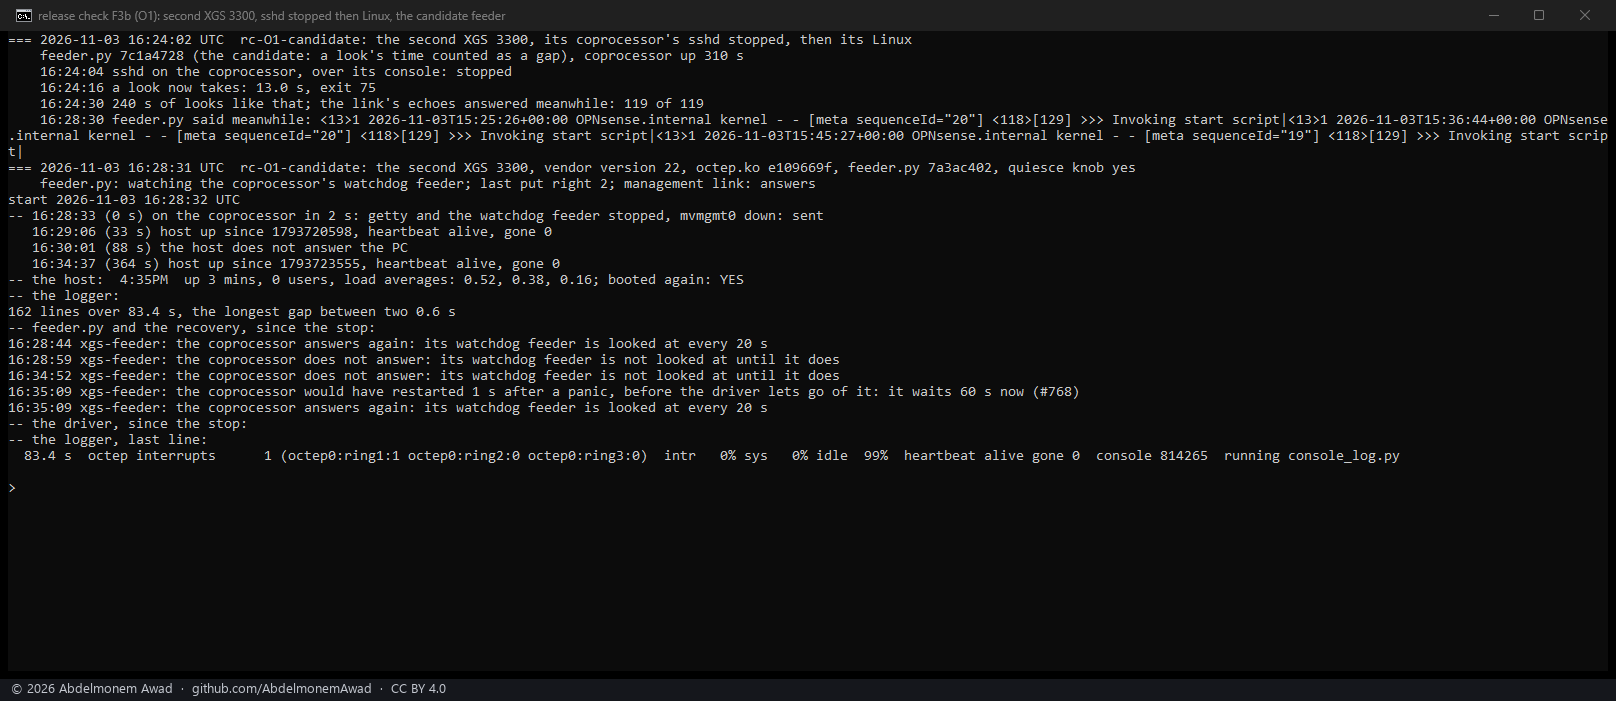
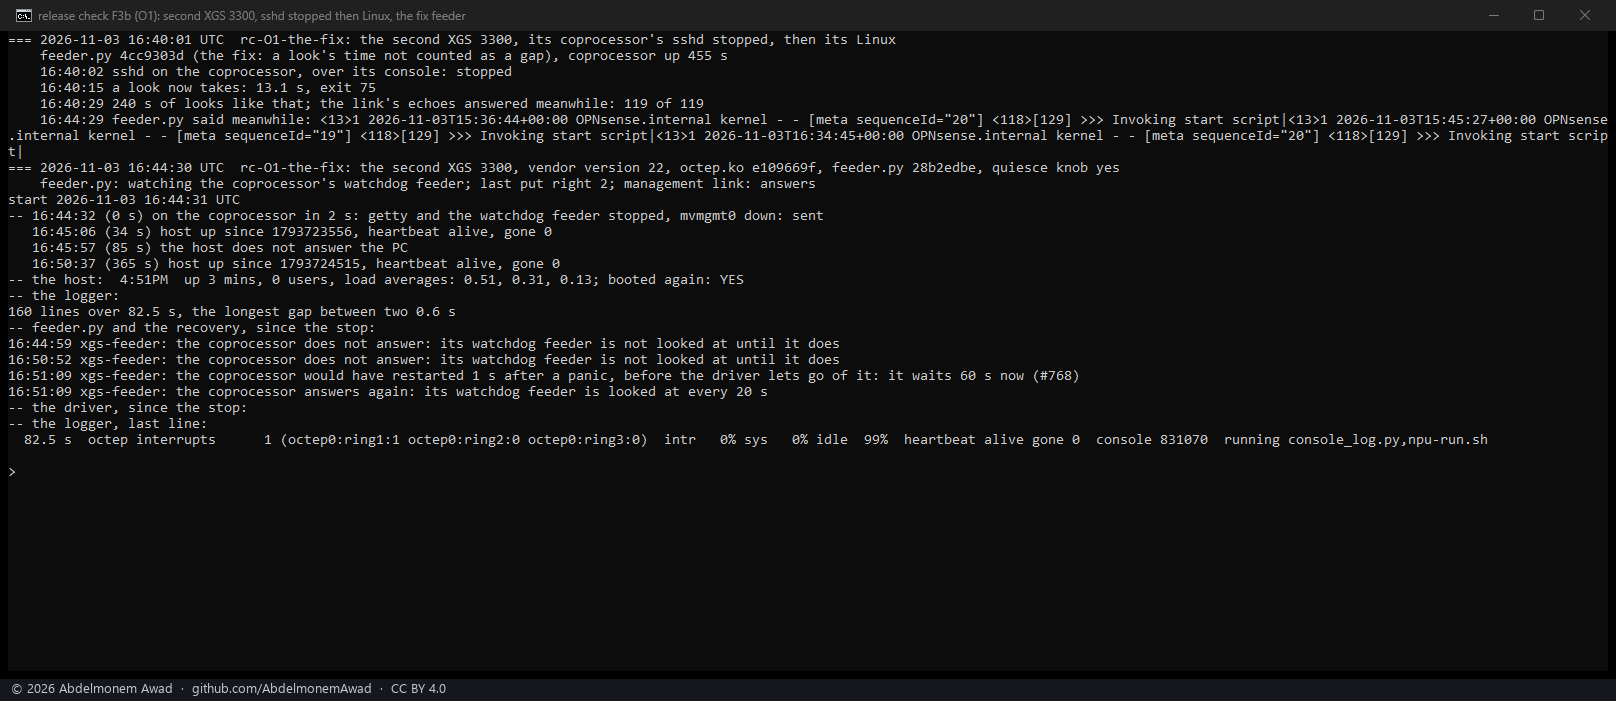
| F3b | second XGS 3300 | the coprocessor's sshd stopped first, four minutes of looks over the console, then 768's stop - sent over the console, from inside a login | 1 + 1 | main's feeder.py: no quiesce, the host froze; 1008's: no quiesce, the host froze. The stop left the console answering - its getty was not stopped - so this was a stopped watchdog feeder with the link down, not a stopped Linux: 1008's watch asked the console, was answered and left it, as it should, and the feeder was not put right before its reset (1002) |
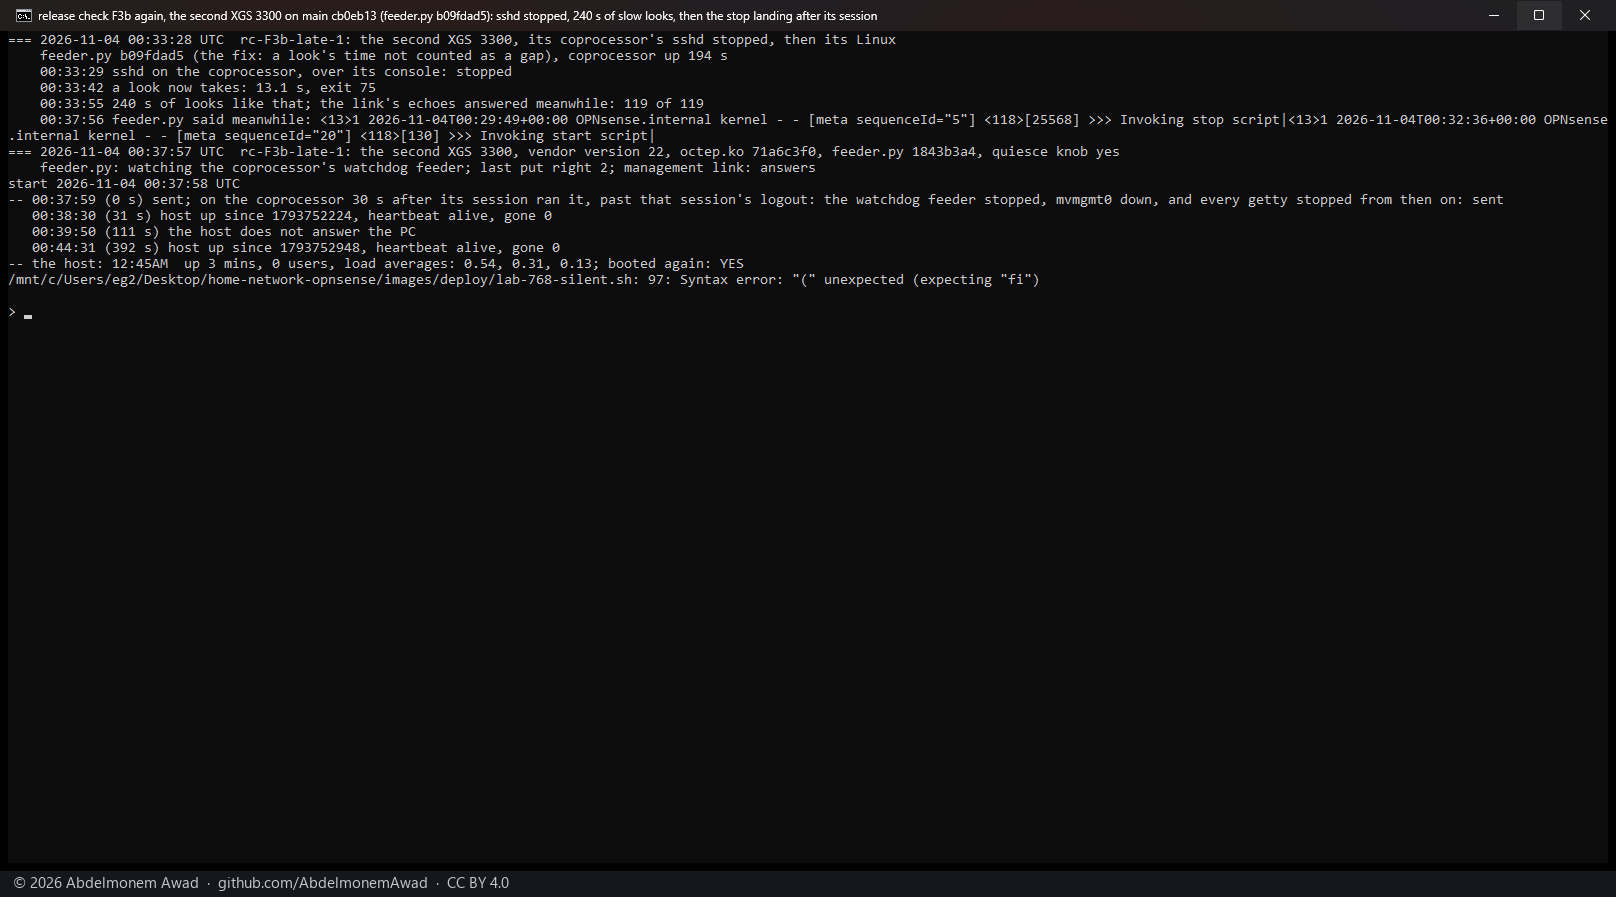
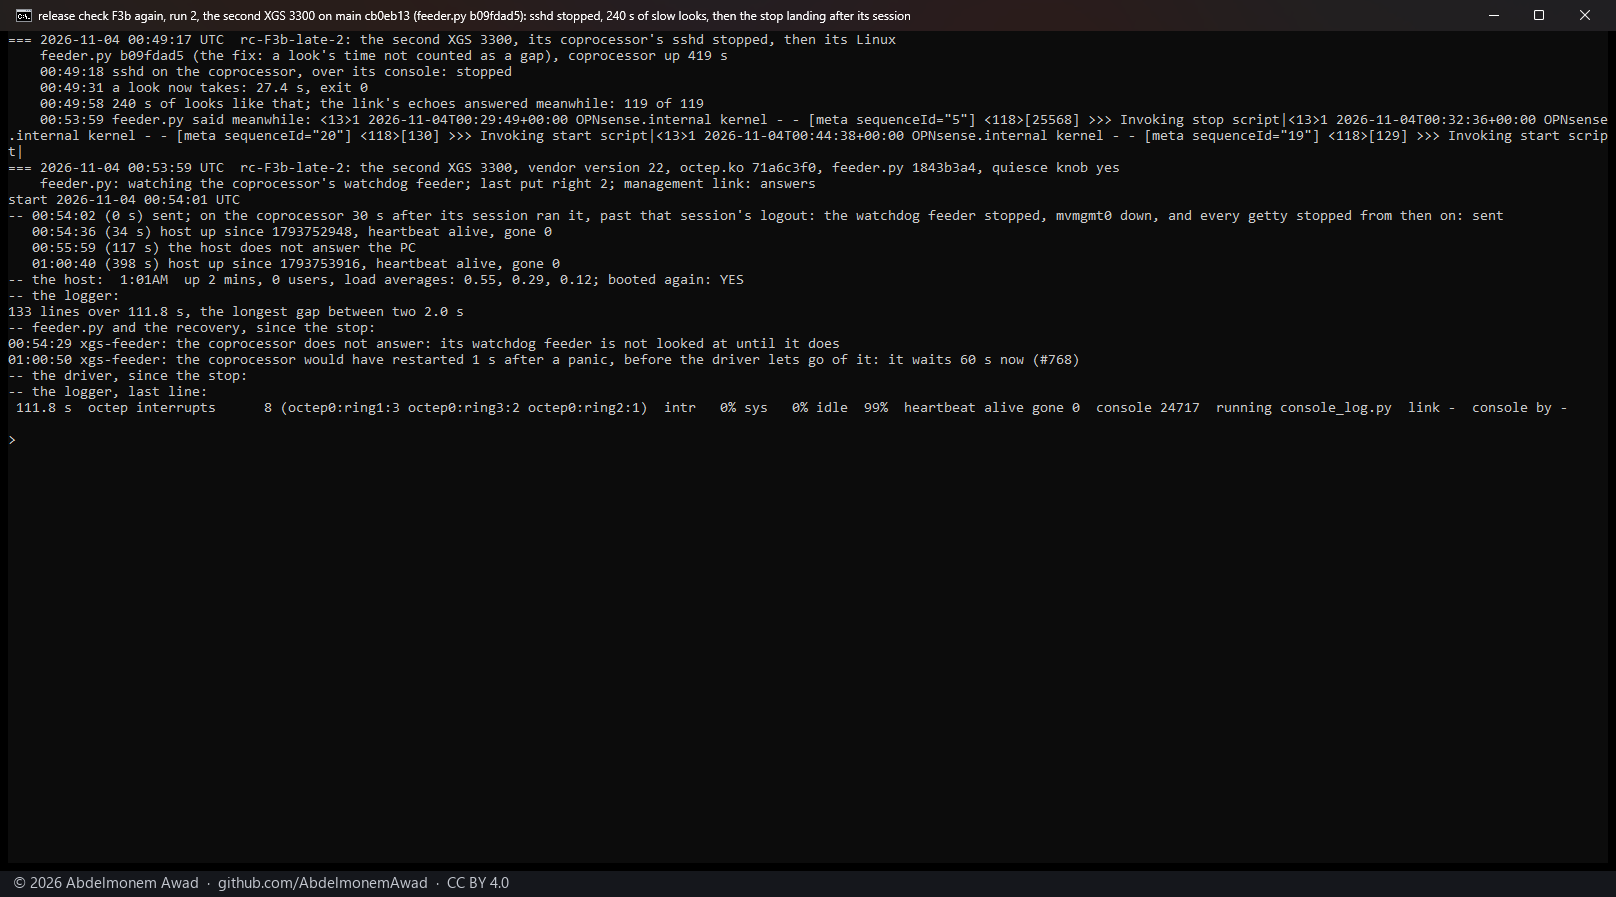
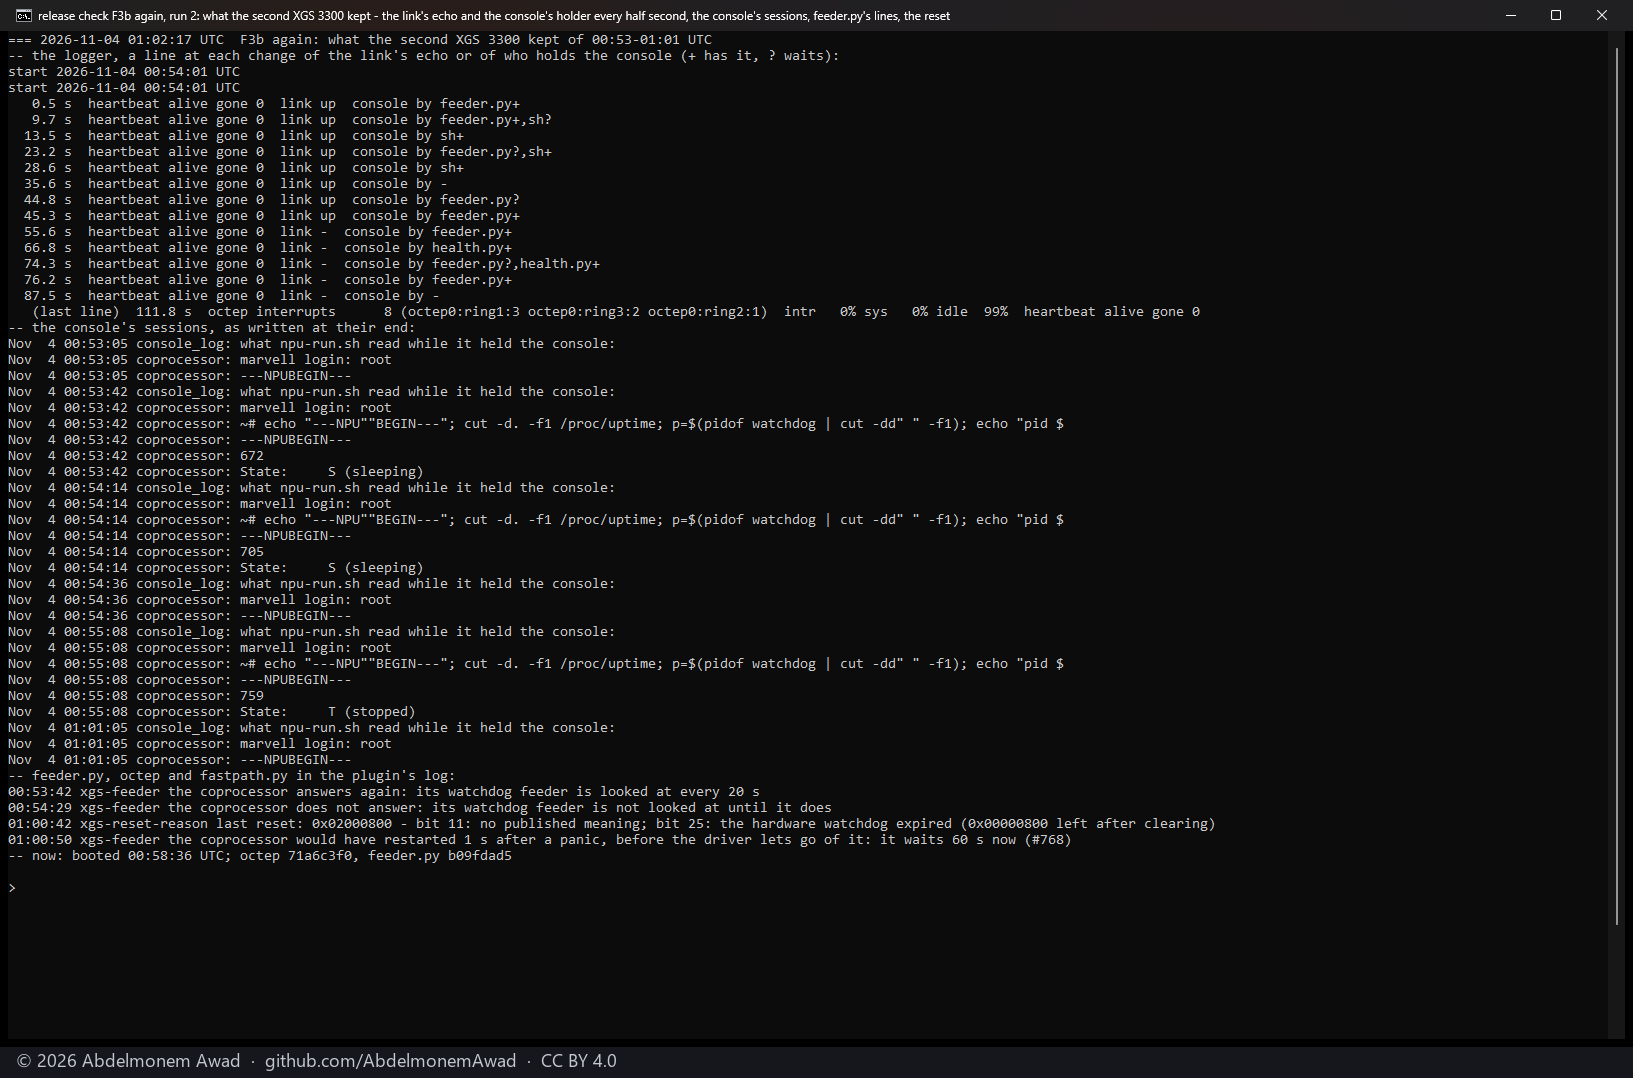
| F3b again | second XGS 3300 | the same on main cb0eb13, after the review - 1008's feeder.py b09fdad5 - with the stop sent so that it lands 30 s after its session ran it, past that session's logout, and every getty stopped from then on |
2 | 2 of 2 froze the host: no quiesce; the stop fell inside a look of feeder.py, which blinded the watch while it lasted (57 s in run 2) and was then lent whole, so the decision fell due after the coprocessor's reset (1012) |
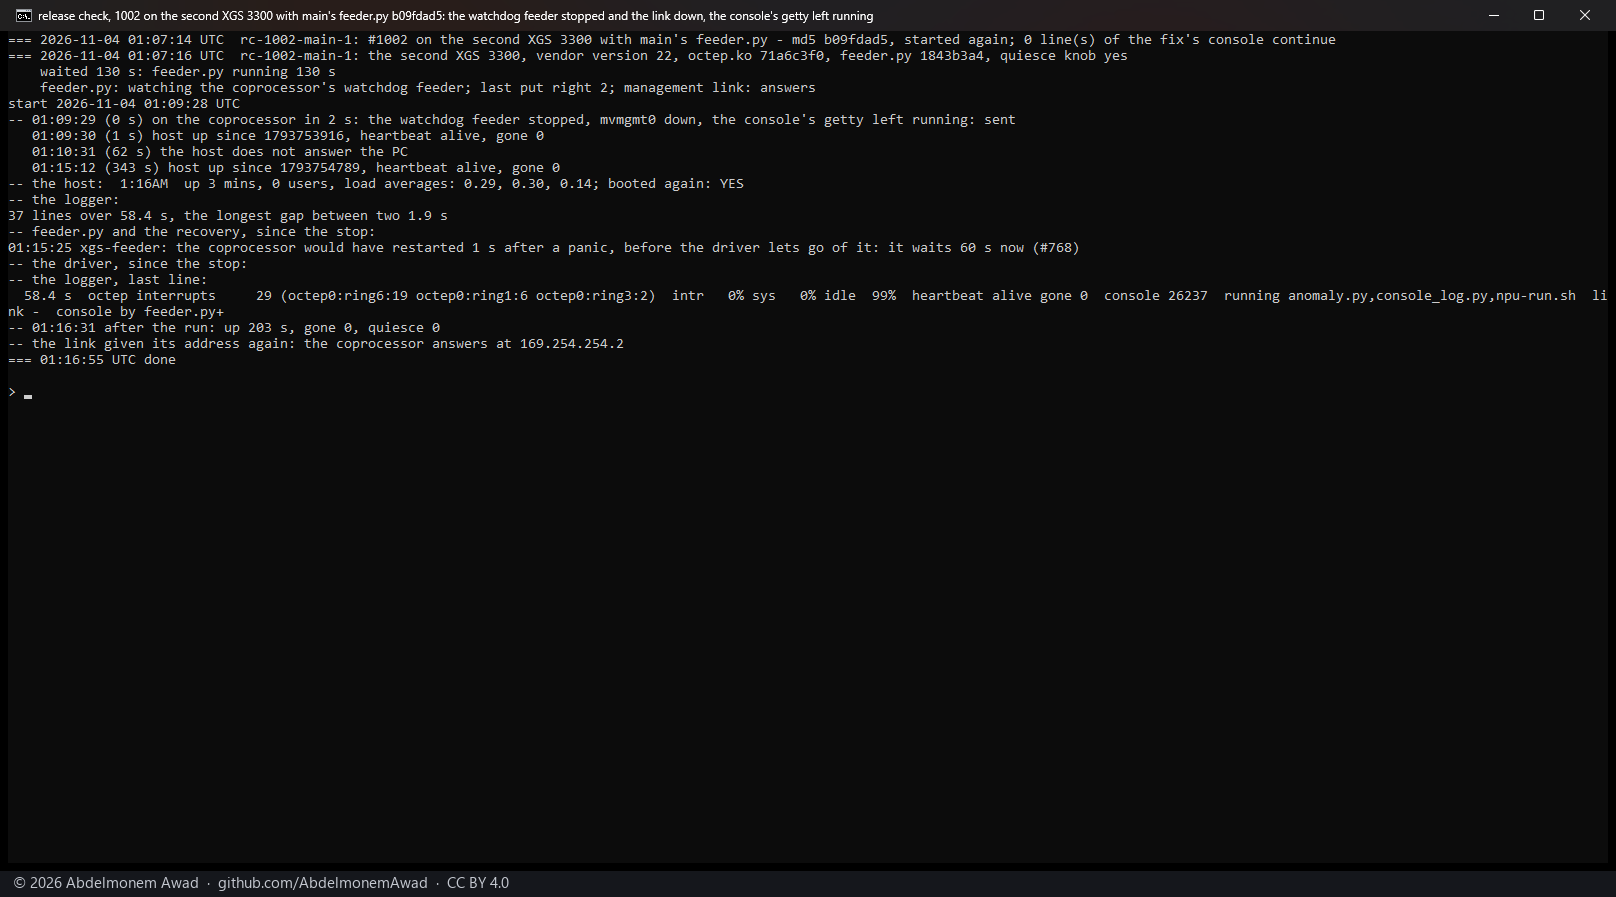
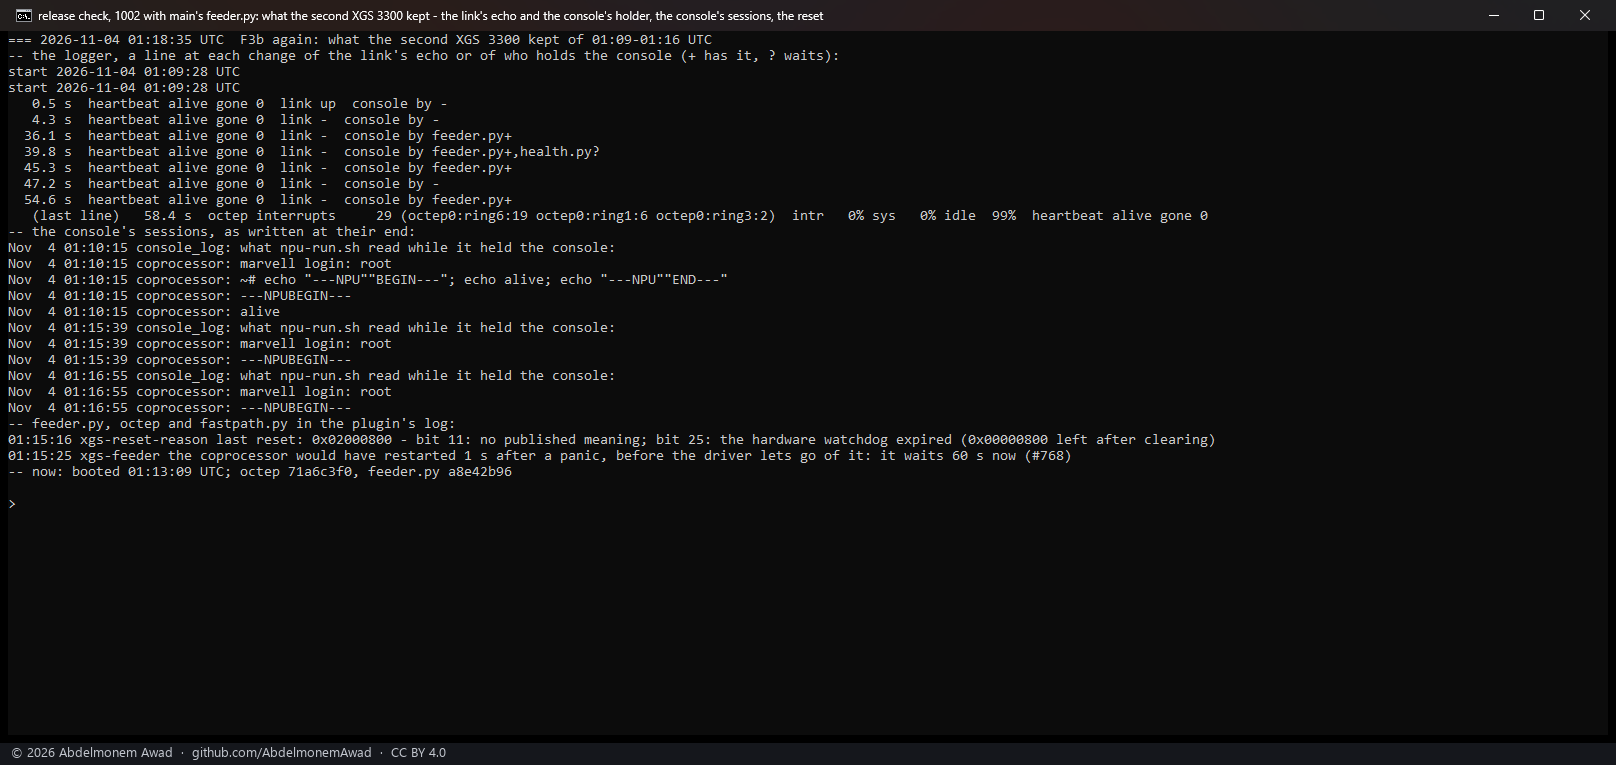
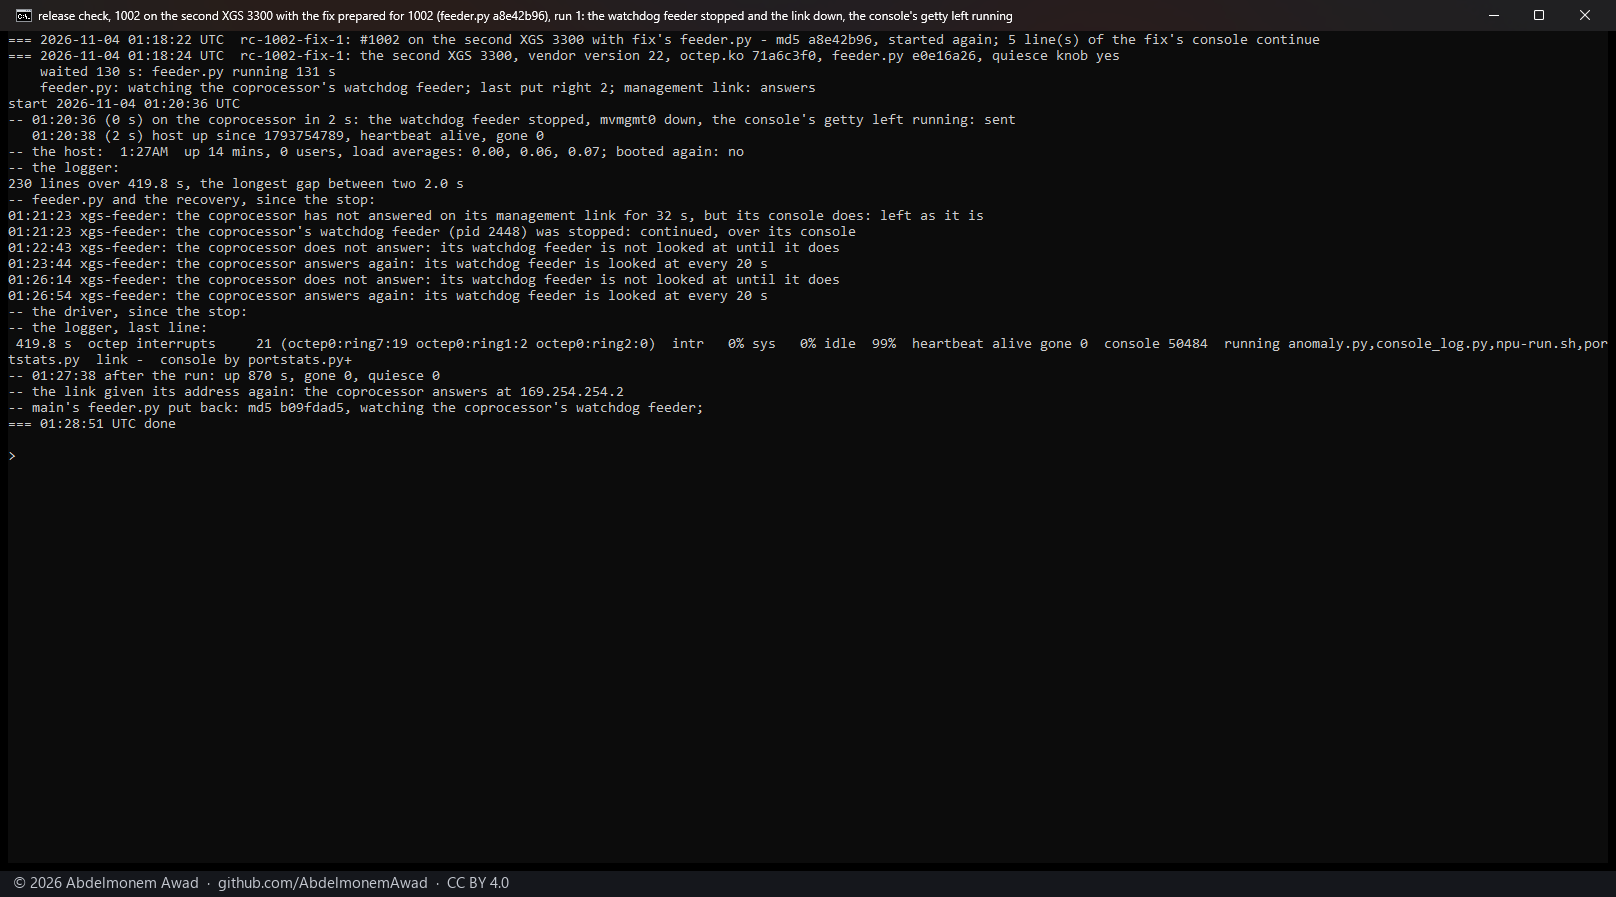
| F12 | second XGS 3300 | 1002's case on main cb0eb13: the coprocessor's watchdog feeder stopped and its end of the link taken down, the console's getty left running |
1 + 2 | main's feeder.py b09fdad5: its console ask answered "alive" and left the coprocessor; the next look reached the console 51 s after the stop, 4 s before the reset - the host froze. The fix prepared for 1002, a8e42b96: its console ask continued the stopped feeder in the same session, about 45 s after the stop - the host lived, 2 of 2 |
| F4 | second XGS 3300 | a panic of the coprocessor's Linux, kernel.panic 60 |
2 | 2 of 2: the host up, the coprocessor back in 213 and 236 s |
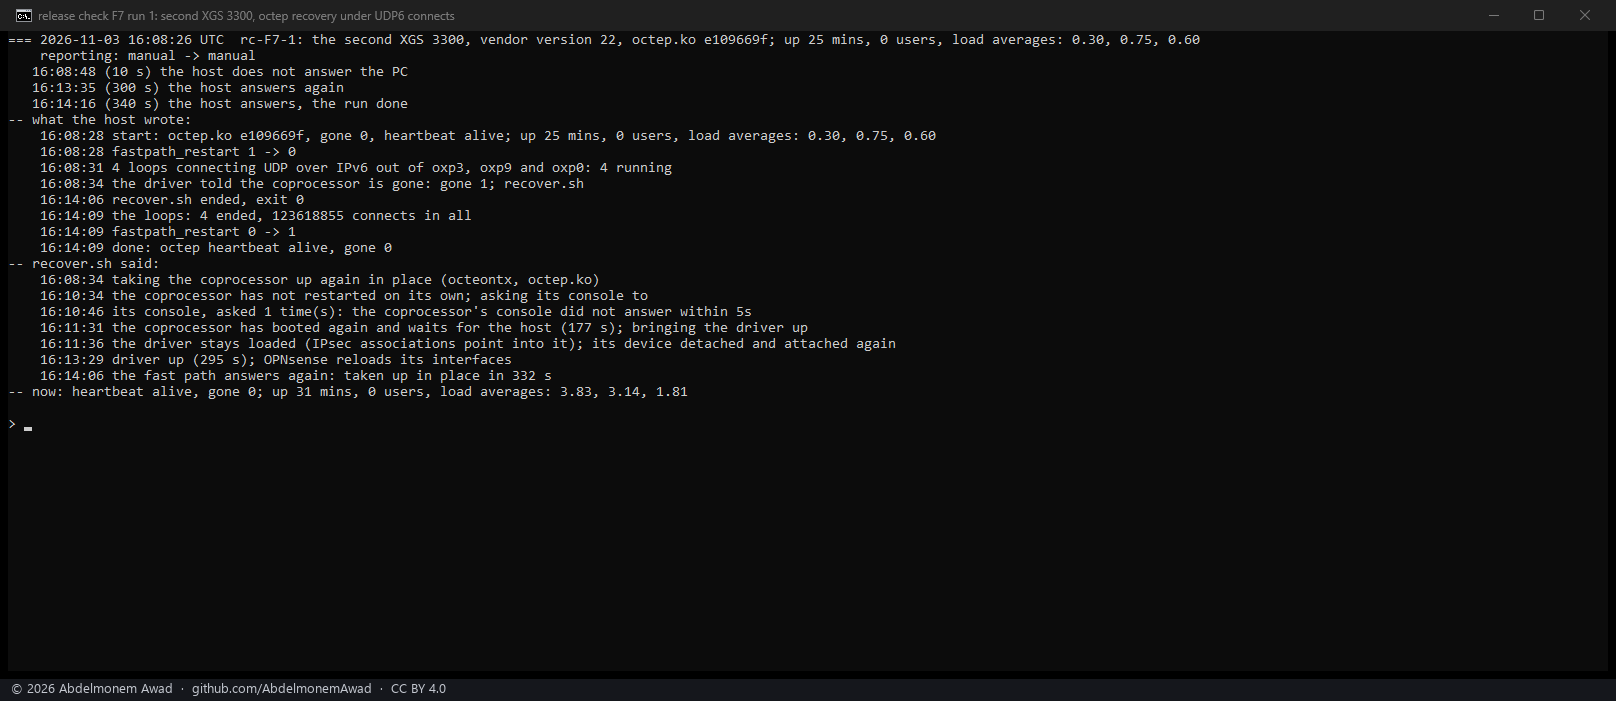
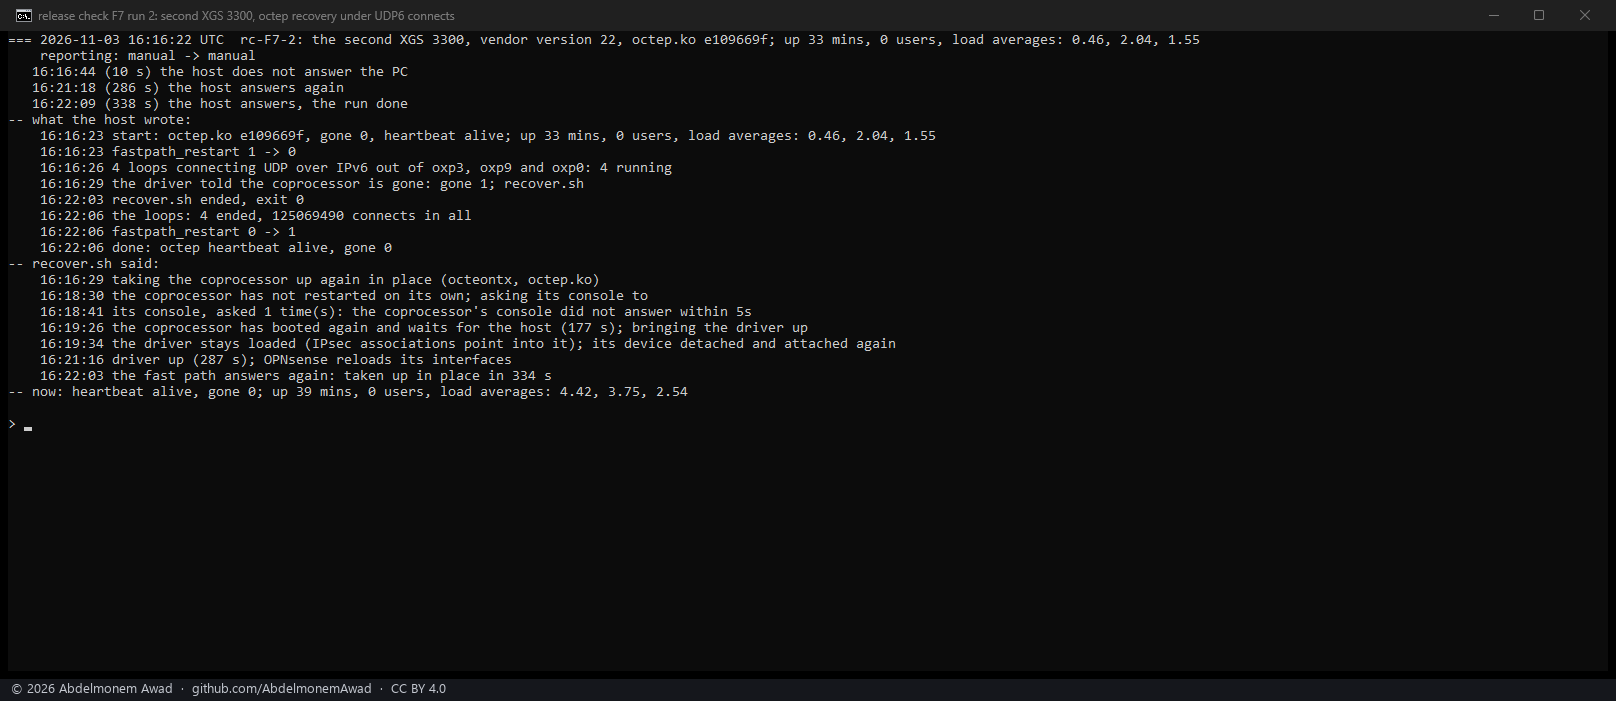
| F7 | second XGS 3300 | an octep recovery under four loops connecting UDP over IPv6 (994 on octep) | 2 | 2 of 2 with no panic, 123.6 and 125.1 million connects, taken up in place in 332 and 334 s; 3 of 3 with the run of that morning |
| F5 | second XGS 3300 | 768's stop as soon as the link answers after a boot | 2 | 2 of 2 froze: no quiesce, the watch needs 120 s of a steady link, as designed |
| F6 | second XGS 3300 | the coprocessor's userland stopped - getty, the watchdog feeder and sshd - its kernel and link left up | 1 | no quiesce (its kernel answers every echo), the host froze at the watchdog's reset |
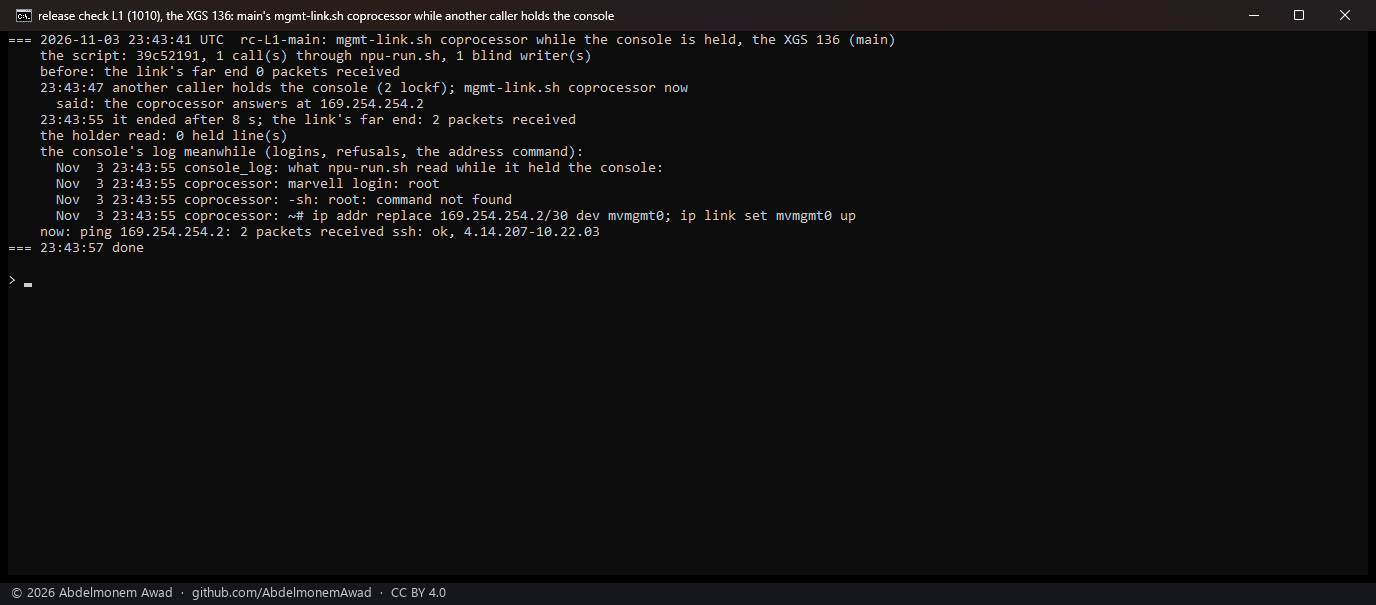
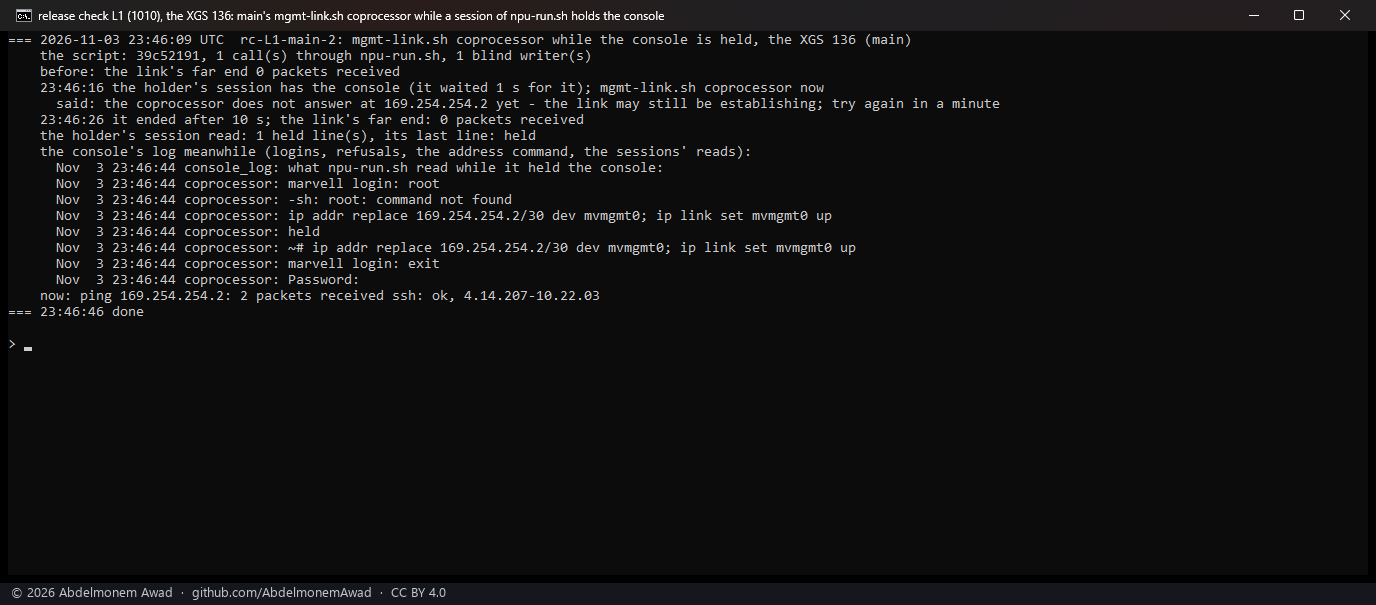
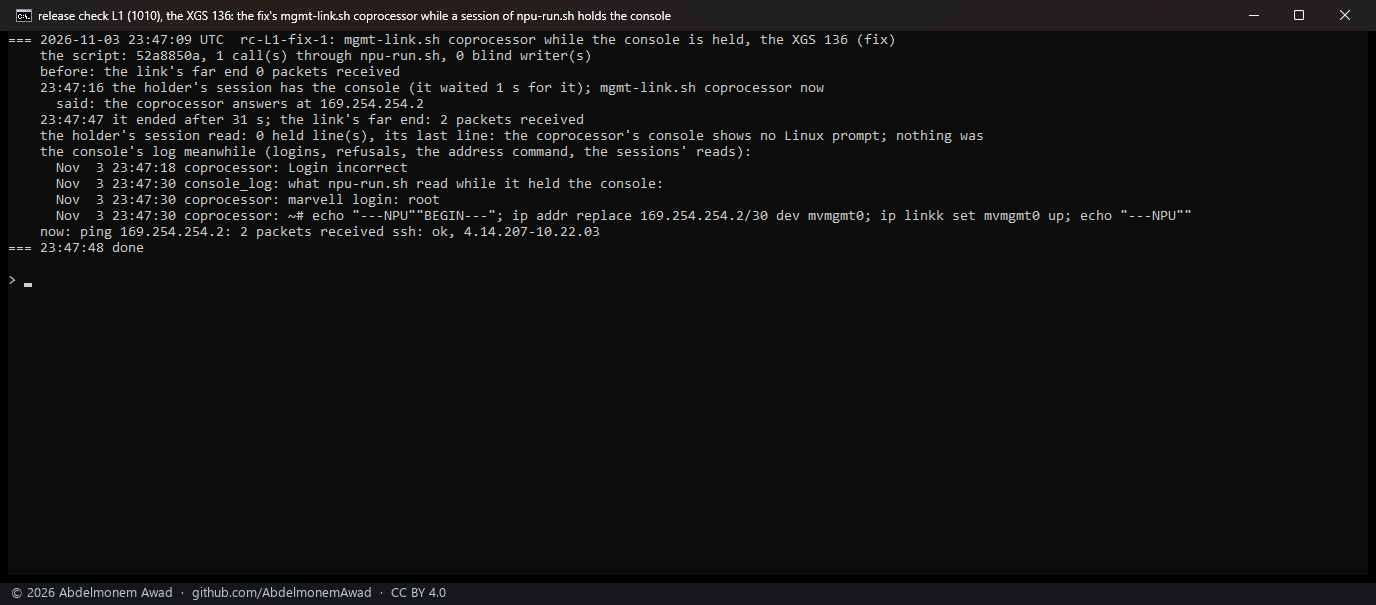
| F11 | XGS 136 | mgmt-link.sh coprocessor while another session of npu-run.sh holds the console, the coprocessor's end of the link without its address (1010) |
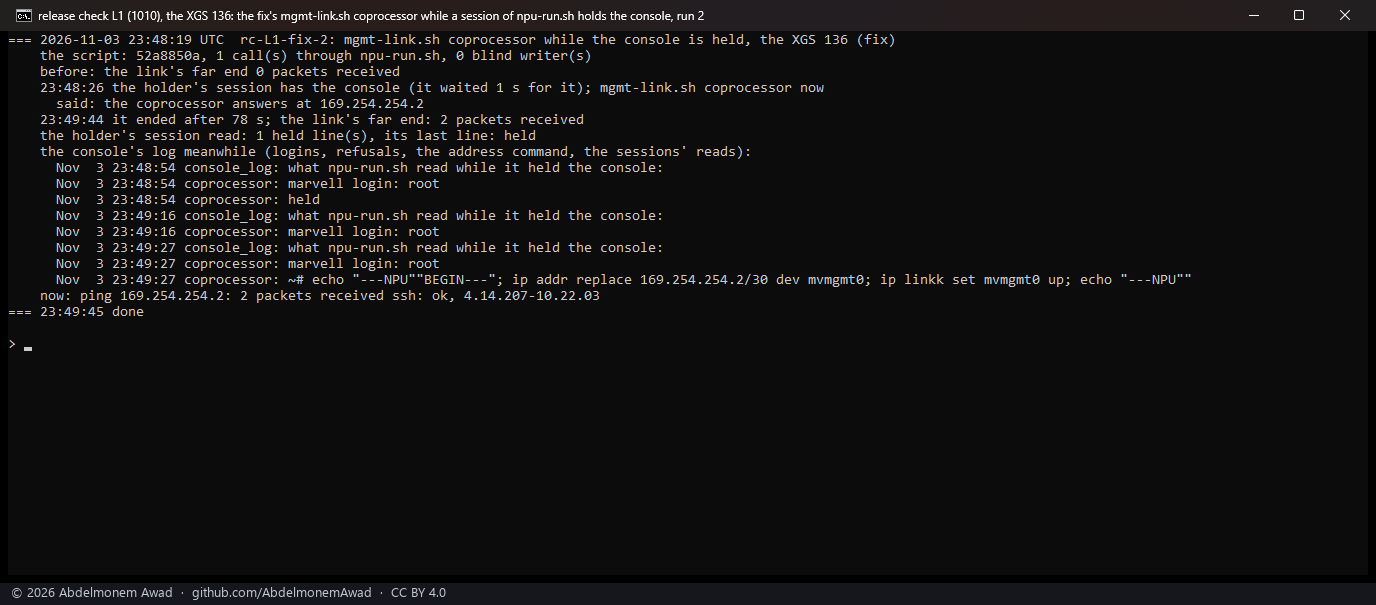
2 + 2 | main's script typed its login into the other session 2 of 2 and left the console at a password prompt, the link up once by its command run in feeder.py's shell; the fix prepared for 1010: the link up 2 of 2, in 31 and 78 s, the other session undisturbed |
F10, devctl detach npuep0. The candidate's module took a page fault in sysctl_root(), called from
npuep_ifnets_quiet(); the fix's detached. The fix's run's first line names 12b01440 - the file on the
disk by then, put there for the next boot by v0.1.0-alpha.12's installer and not loaded; the module that
ran was the fix's 4780b80e, loaded at that boot (its kernel's log: npuep0 attached at 11:54:43,
detached at 12:07:34, attached again only at the next boot).
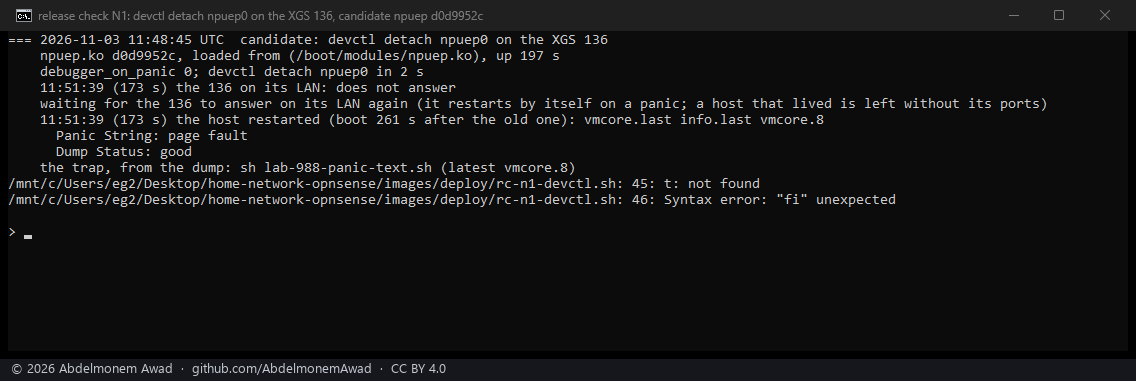
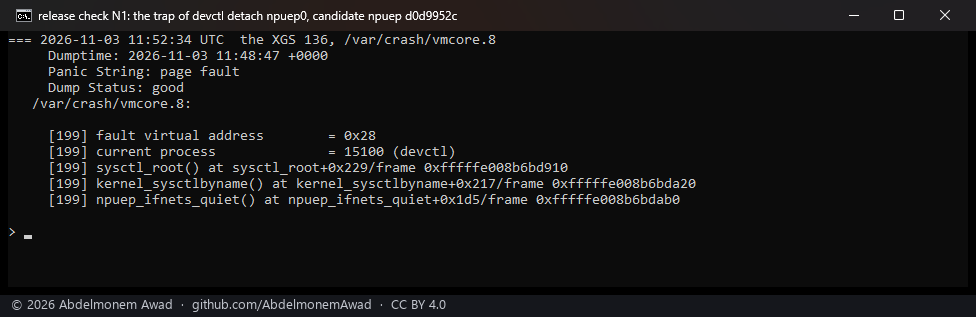
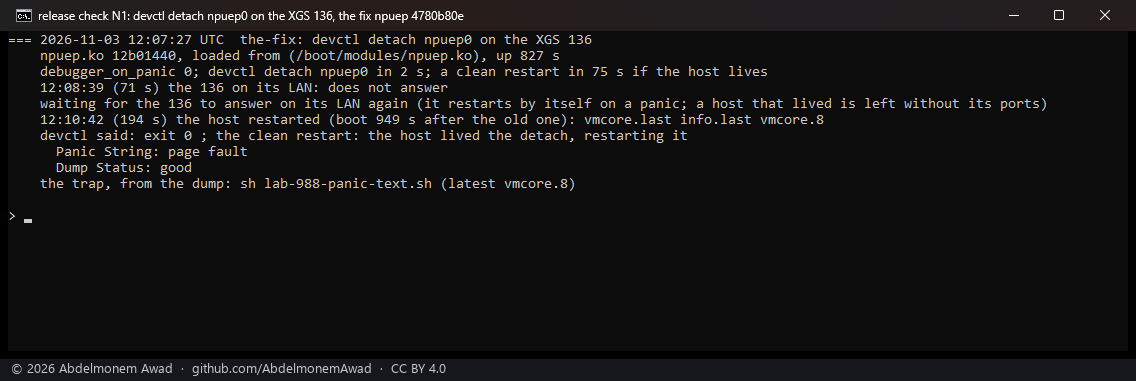
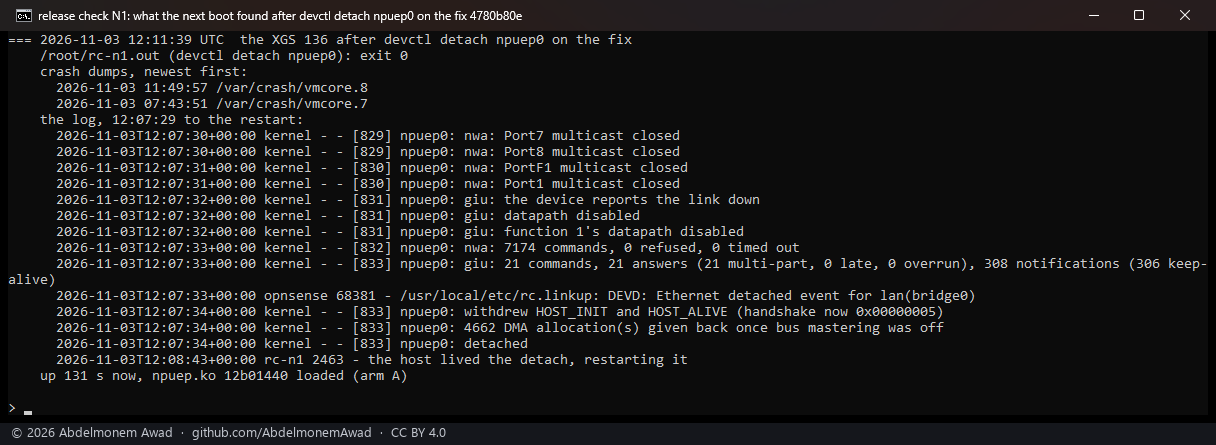
F1, F2 and F9 on the XGS 136.
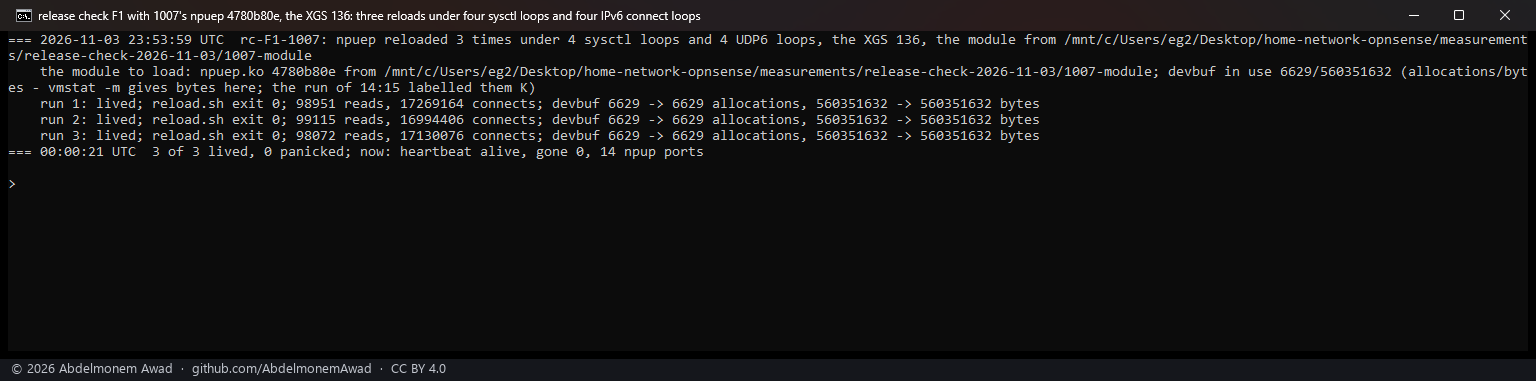
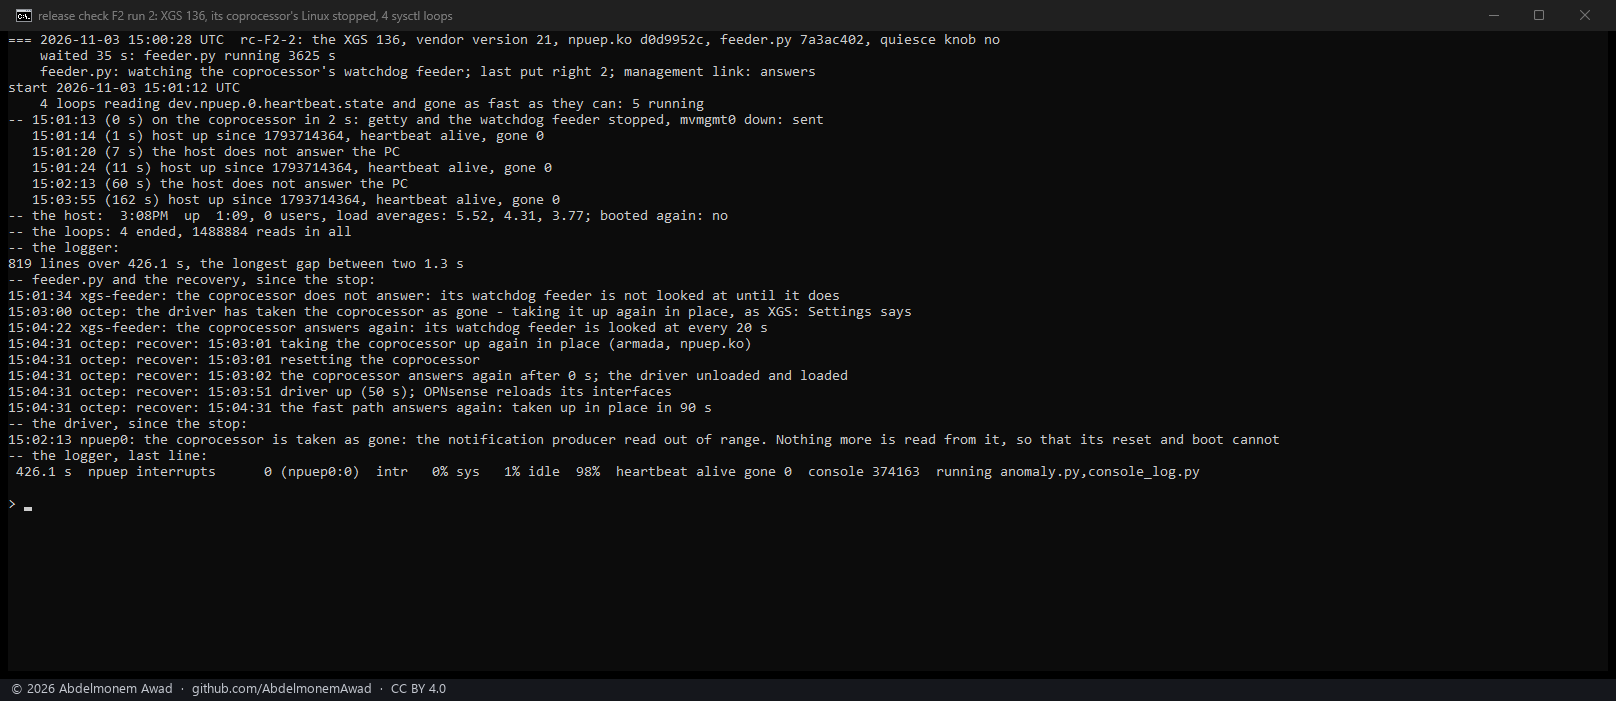
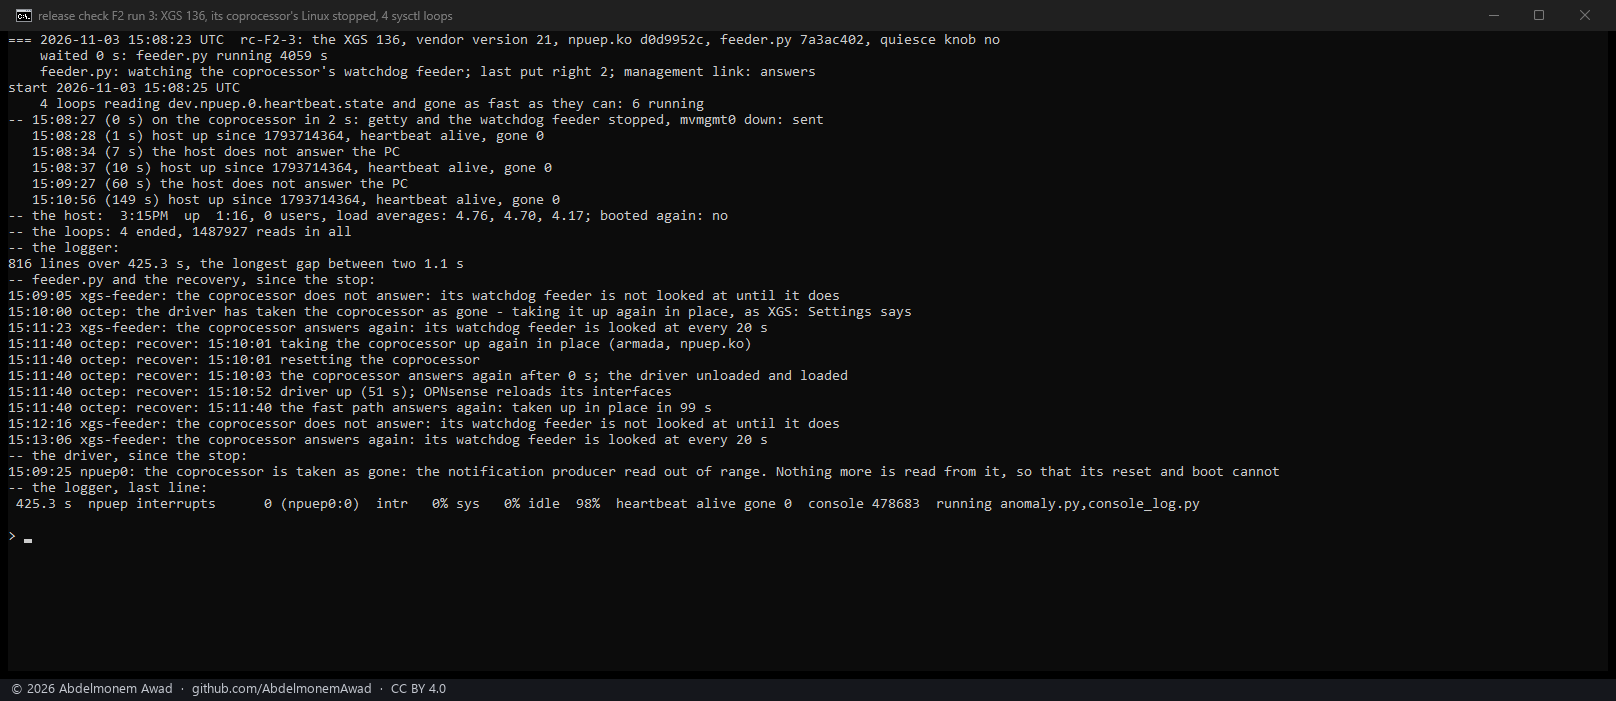
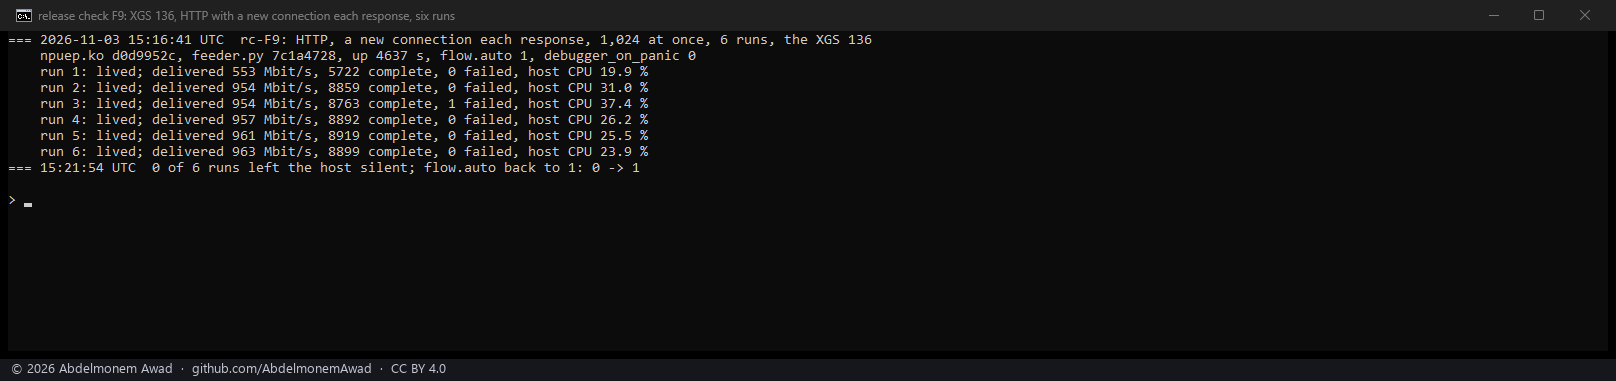
F11 on the XGS 136, after the soak, 23:43-23:50: mgmt-link.sh coprocessor while the console is
held (1010). The coprocessor's end of the
host's link to it without its address - as after F2's third run, and taken away over the link before
each run after the first - and the script started while another session of npu-run.sh held the
console (images/deploy/rc-l1-test.sh):
| run | script | the session that held the console | what the script did | the link | the other session |
|---|---|---|---|---|---|
| 1 | main's, md5 39c52191 |
feeder.py's look (the test's own holder could not get the console) | typed its login into that session (root: command not found) and its address command after it; said "answers" in 8 s |
up, by its command run in feeder.py's shell | logged out by its exit; the console left at a password prompt |
| 2 | main's | the test's holder, 25 s | typed the same into the holder's session while it slept; said "does not answer ... yet" and ended in 10 s | down when it ended; up later, when the holder's shell ran what it had queued | read its own line; the console left at a password prompt |
| 3 | the fix prepared for 1010, md5 52a8850a |
the test's holder, which found run 2's password prompt and gave up | waited for the console, logged in in a session of its own and gave the address there | up in 31 s | - |
| 4 | the fix | the test's holder, 25 s, and then a look of feeder.py | waited through both, then the same | up in 78 s | read its own line, undisturbed |
The console's echo doubles a letter now and then (ip linkk set in photos 64 and 65); nothing was
printed between the session's markers, so both of the fix's commands ran without an error. The fix
is not in a pull request yet.
F8, F3, F4, F7, F5 and F6 on the second XGS 3300.
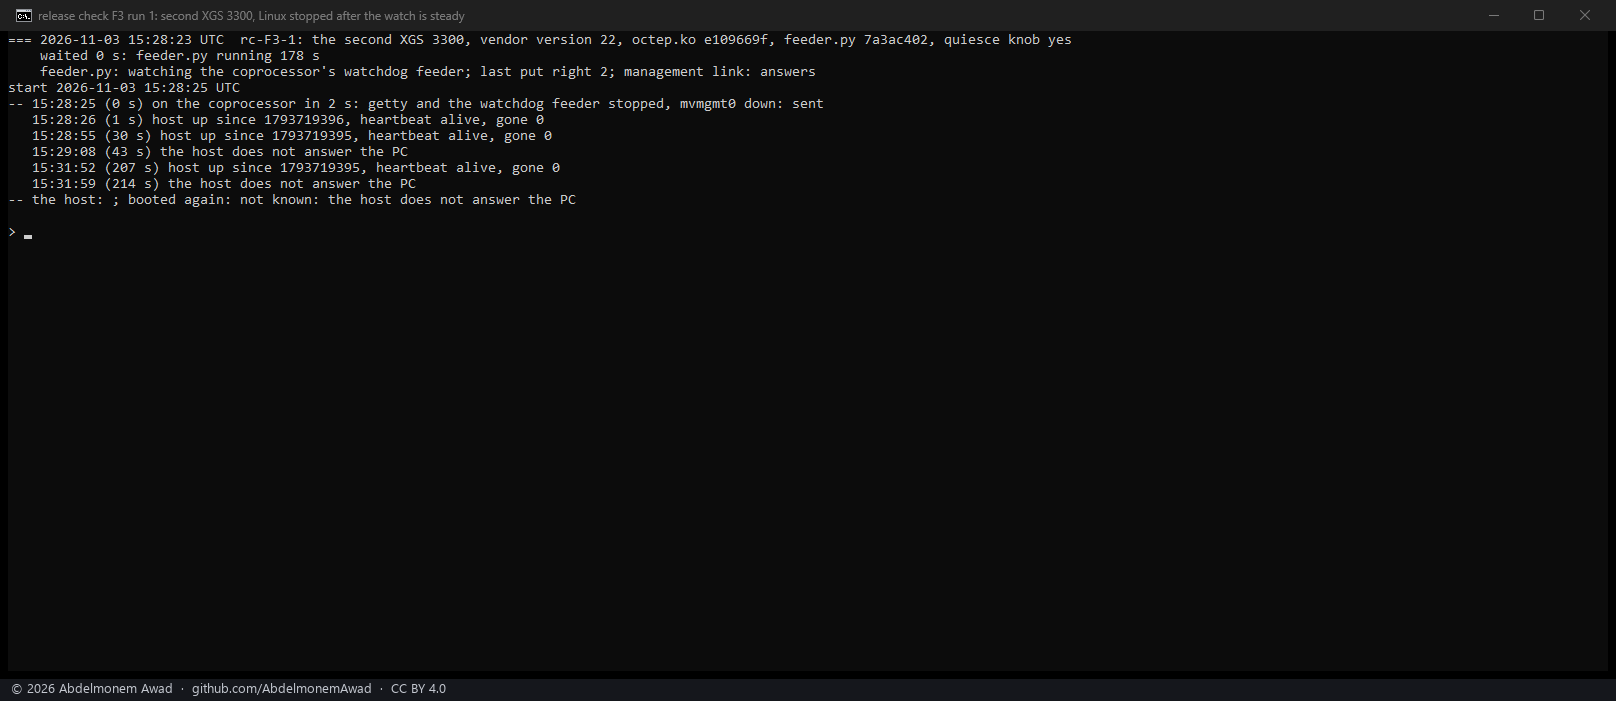
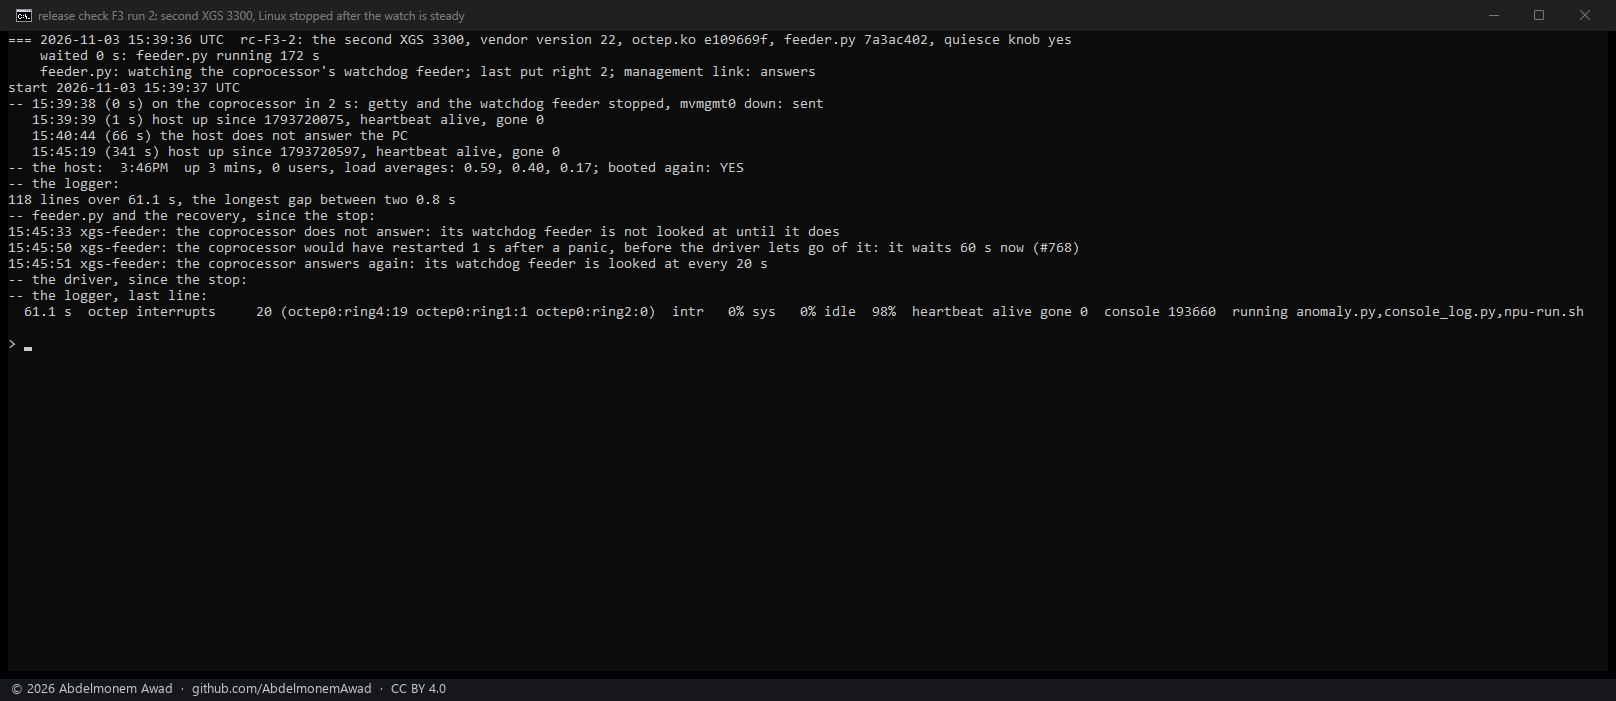
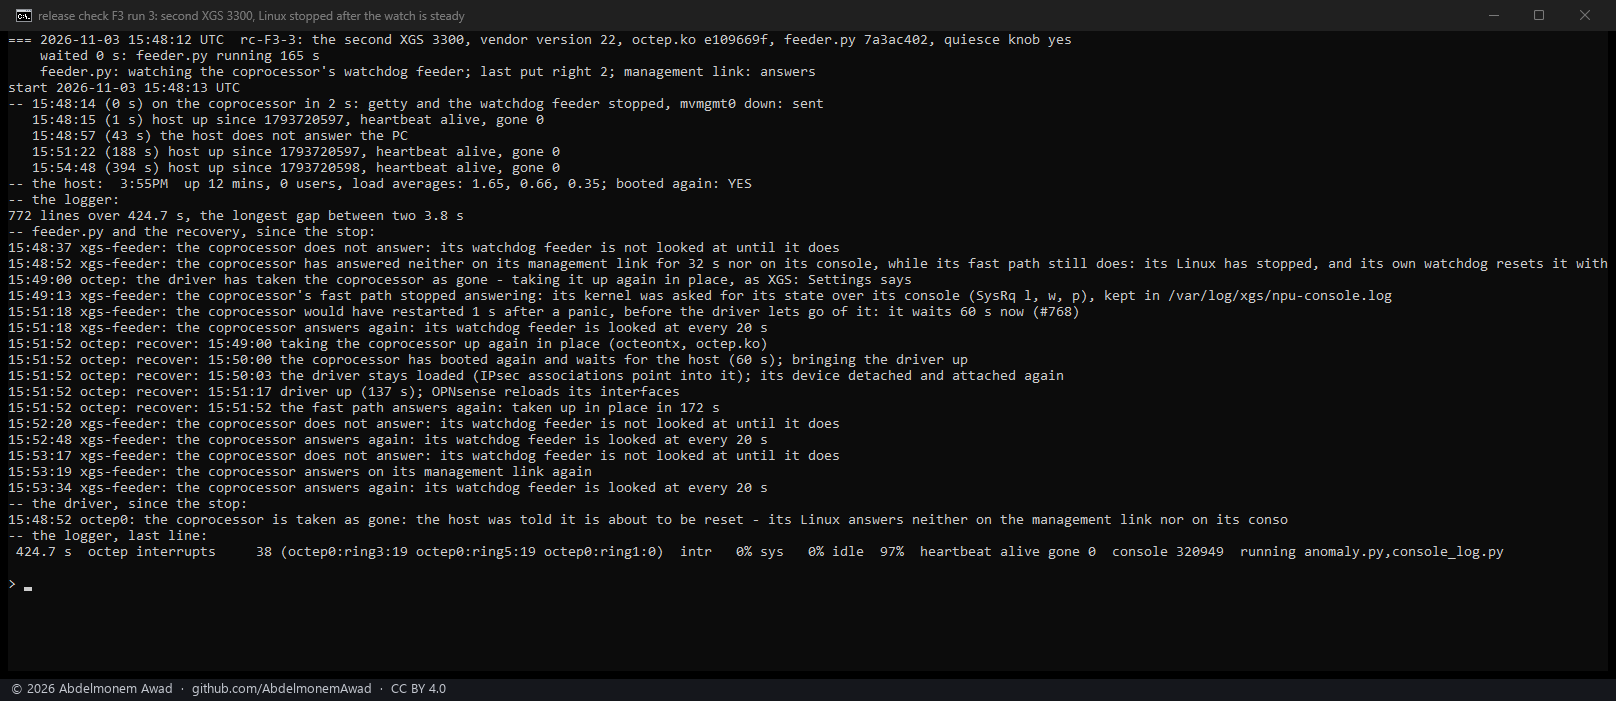
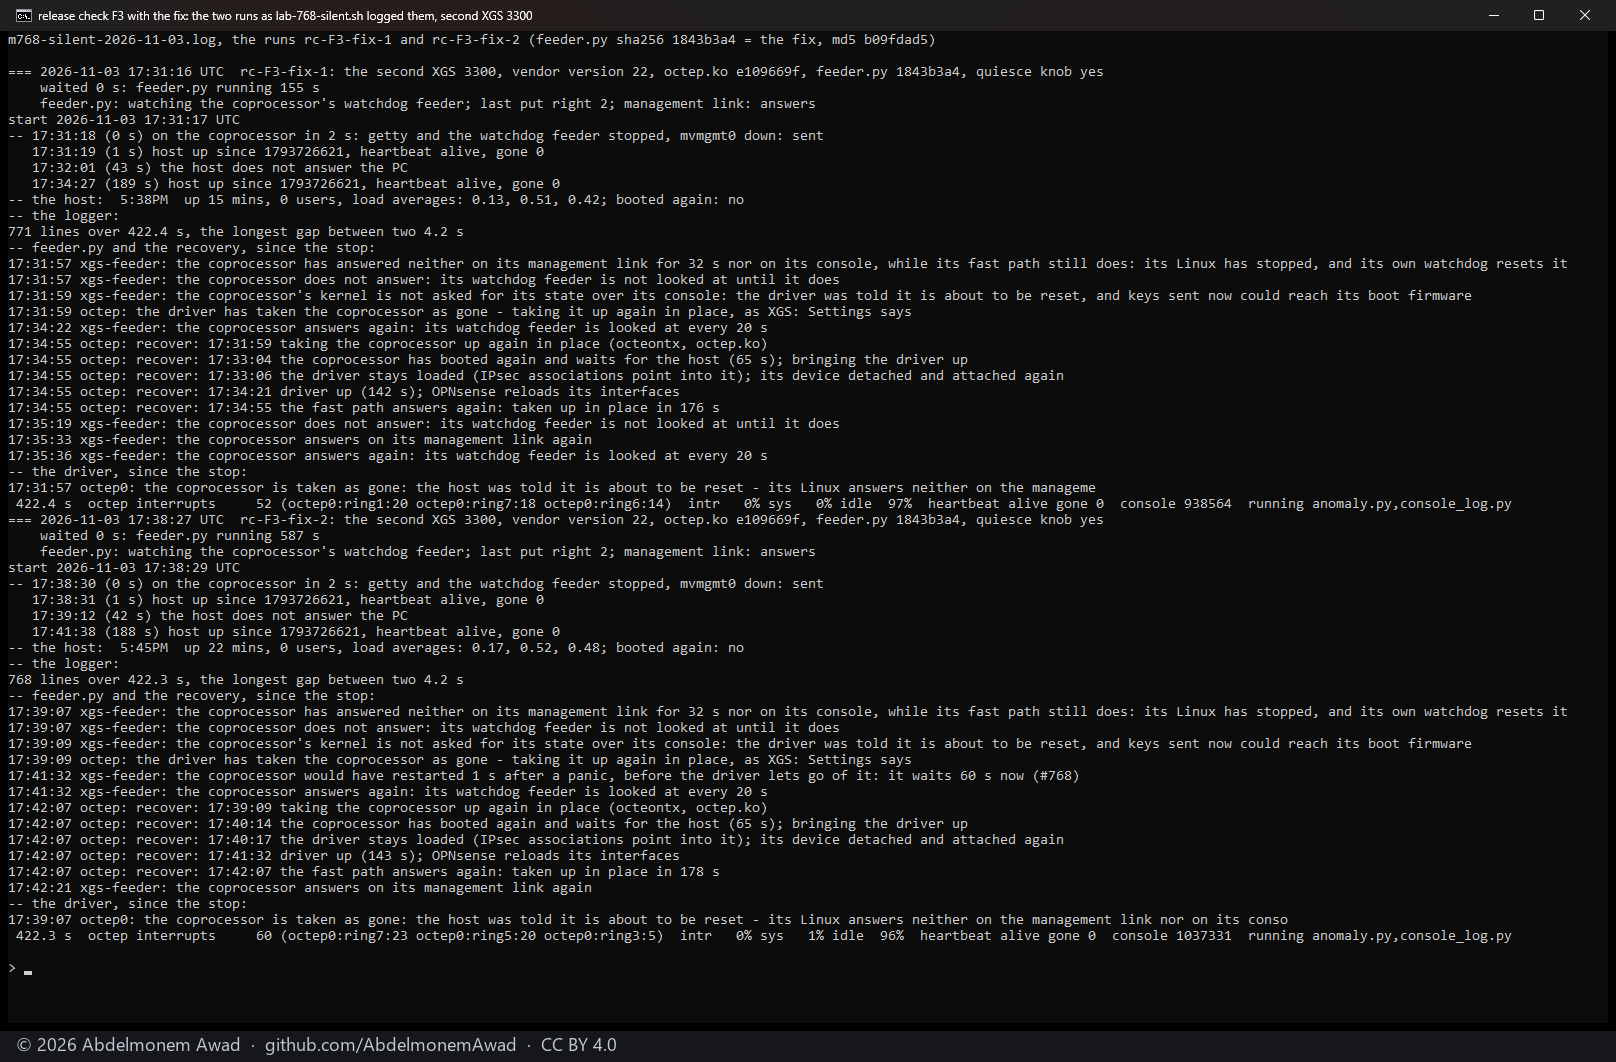
F3b again, 2026-11-04, after the four fixes merged (1012).
The second XGS 3300 on main cb0eb13 (octep 71a6c3f0, feeder.py b09fdad5); its coprocessor's sshd
stopped, a look then taking 13.1 s (run 1) and 27.4 s (run 2), and after 240 s the stop, nohup'd so
that it waited 30 s past the session that sent it: the watchdog feeder stopped, the link down, and every
getty stopped once a second from then on. Run 2's half-second logger also wrote the link's echo and who
held the console:
| UTC | the link | the console |
|---|---|---|
| 00:54:46 | answers | feeder.py's look has it, after its npu-run.sh tried ssh for 10 s |
| between 00:54:46 and 00:54:57 | stops answering | the look's session |
| 00:55:08 | - | that session ends, having read the watchdog feeder T (stopped); health.py's next |
| 00:55:15-00:55:28 | - | the look's second session, to continue the feeder: it waits, then finds no Linux prompt |
| 00:55:28 | - | the look ends, 57 s after it began; nobody holds the console after it |
| 00:55:53 | - | the logger's last line, heartbeat alive and gone 0: the host froze at the coprocessor's reset |
Both runs: reset reason bit 25, the host's hardware watchdog. A look runs in the watch's own loop - no echo goes out and the link is not looked at while it lasts - and its time is then lent to the link, so the silence counted only from the look's end and its decision fell due about 00:55:58, after the reset.
F12, 1002's case, 2026-11-04. On main cb0eb13, the
watch steady first: the coprocessor's watchdog feeder stopped and its end of the link taken down, sent over
the link while its sshd answered, its console's getty left running - what F3b's first runs turned out to
be. Then the same with the fix prepared for 1002 put in place of main's feeder.py for the run: a look's
console session, and the watch's own console ask, continue a watchdog feeder found stopped in the session
that found it, instead of a second session.
| feeder.py | the link silent | the watch asks the console | the stopped feeder | the host |
|---|---|---|---|---|
main's b09fdad5 |
01:09:32 | 01:10:04, answered "alive": left as it is | the next look has the console at 01:10:23; the coprocessor resets at about 01:10:26 | froze, bit 25 |
the fix, a8e42b96, run 1 |
01:20:40 | 01:21:12; answered "alive" and continued the feeder | continued about 45 s after the stop; the next looks read it sleeping | lived |
| the fix, run 2 | 01:32:14 | 01:32:46; the same | the same | lived |
The fix is not in a pull request yet. Where the stop falls inside a slow look, the watch's ask comes too late for it as well (1012).
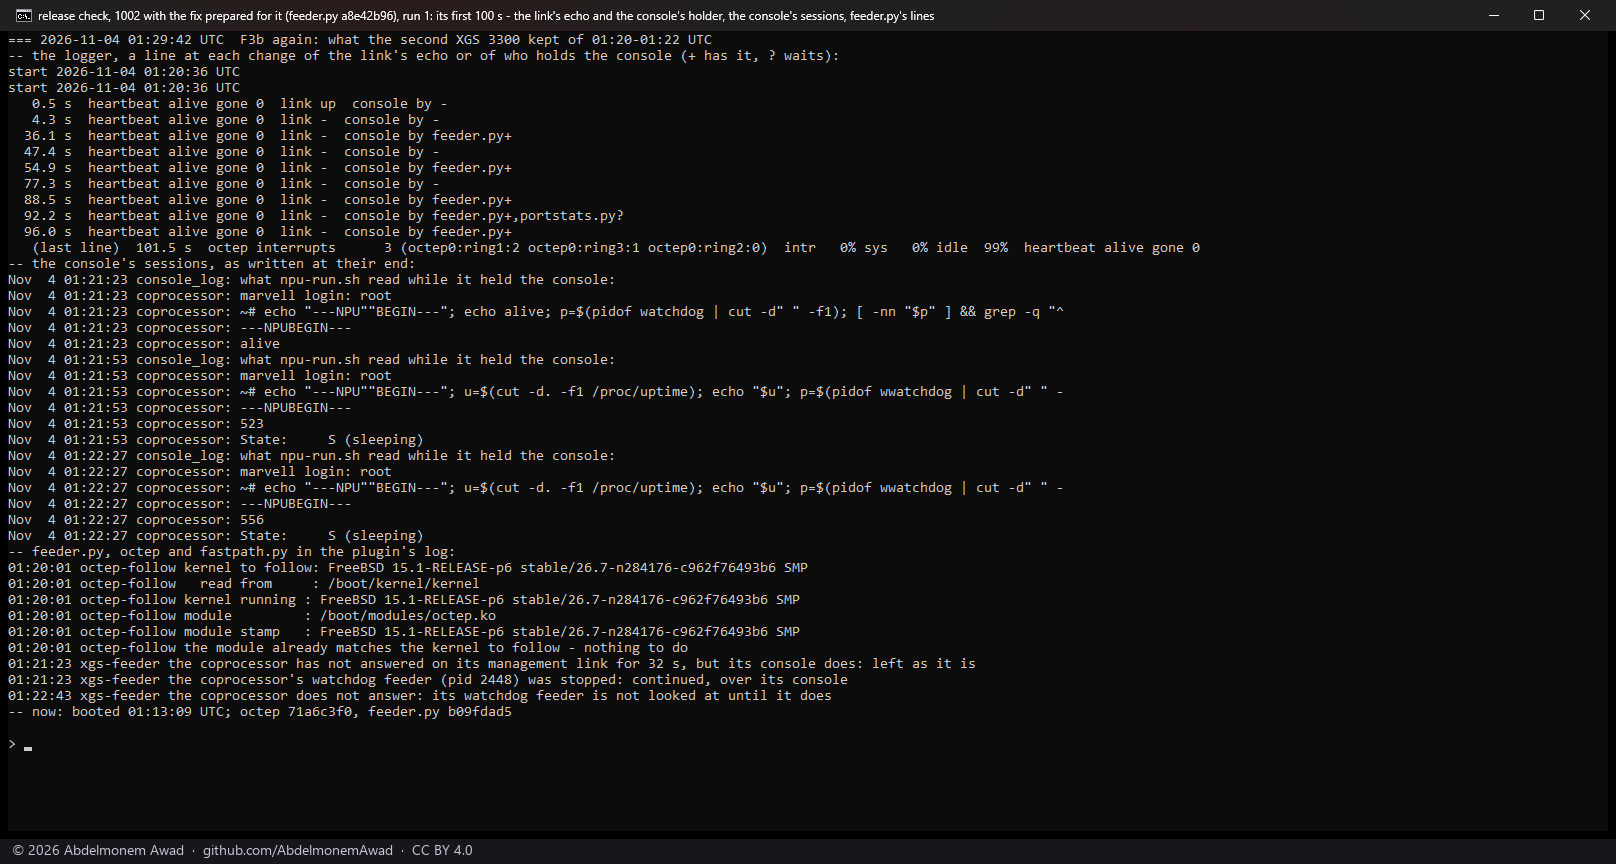
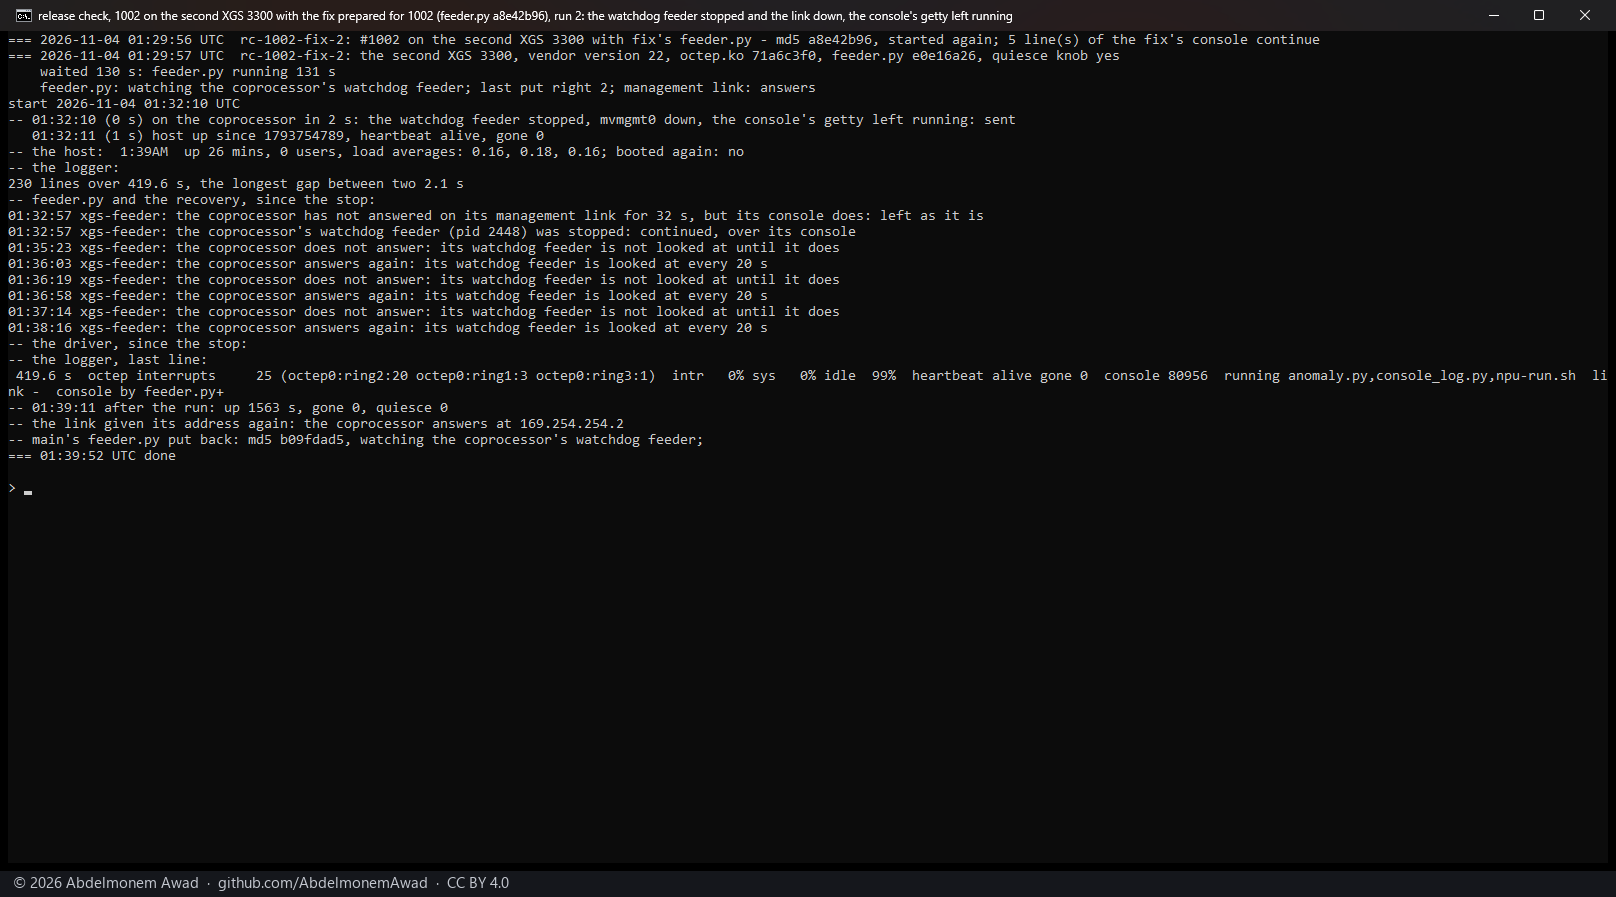
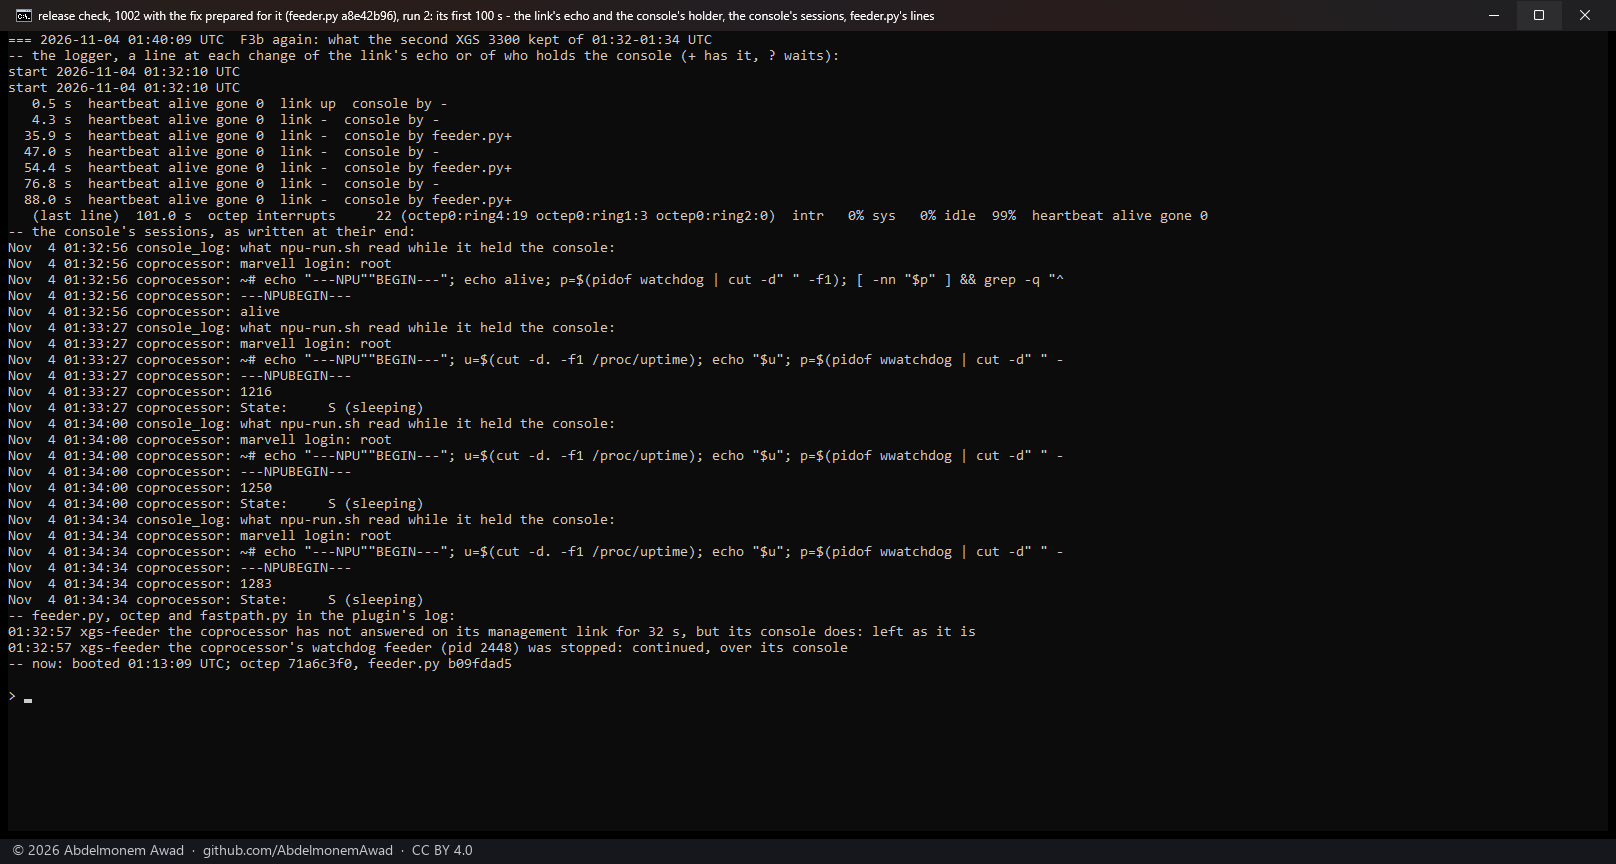
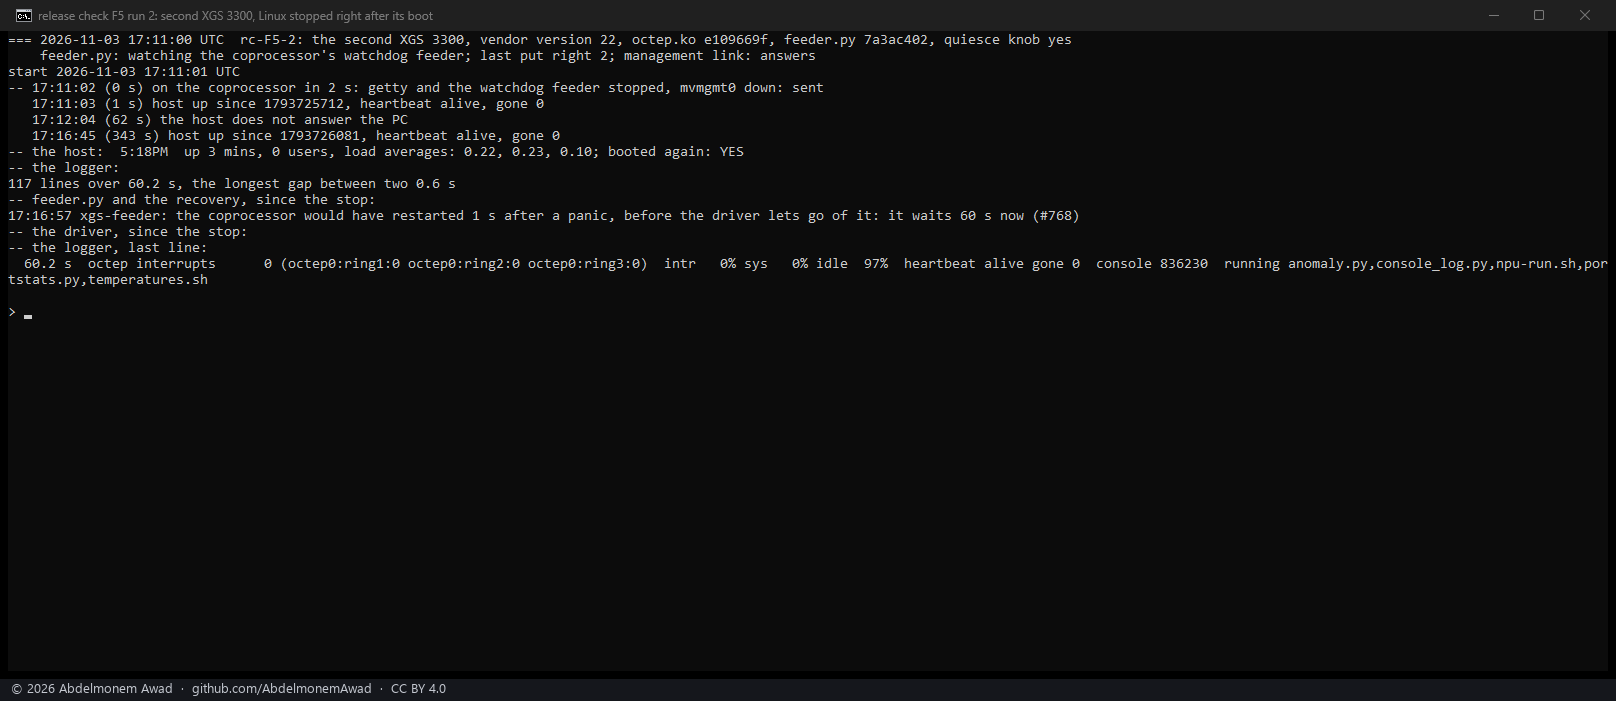
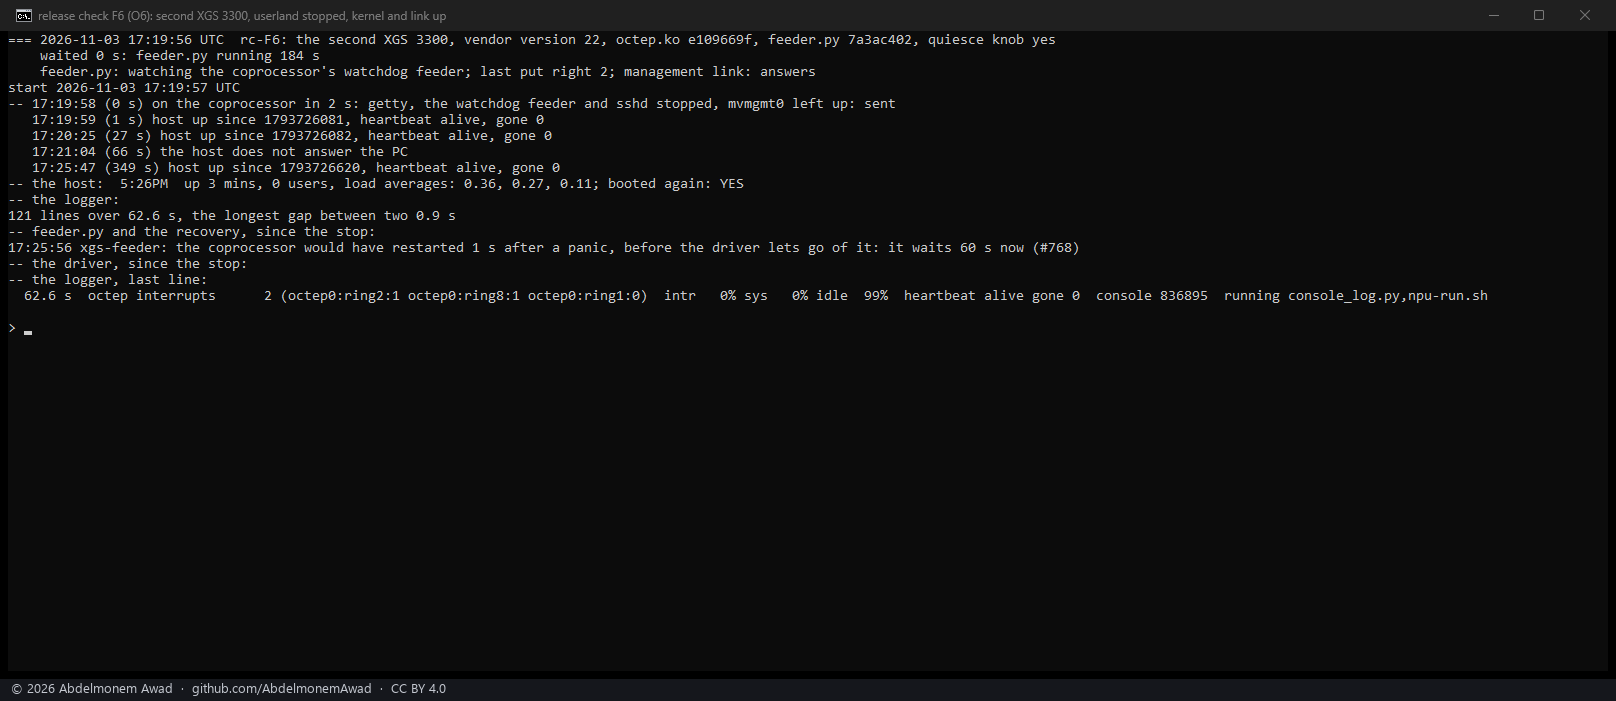
The two F3 runs with 1008's feeder.py also ran a watcher of the console's lock, to see who holds the console while the link is silent; its patterns matched its own commands, so every sample shows the watcher itself, and its photographs are not published. Who holds the console in the plain stop is not measured.
5. The soak
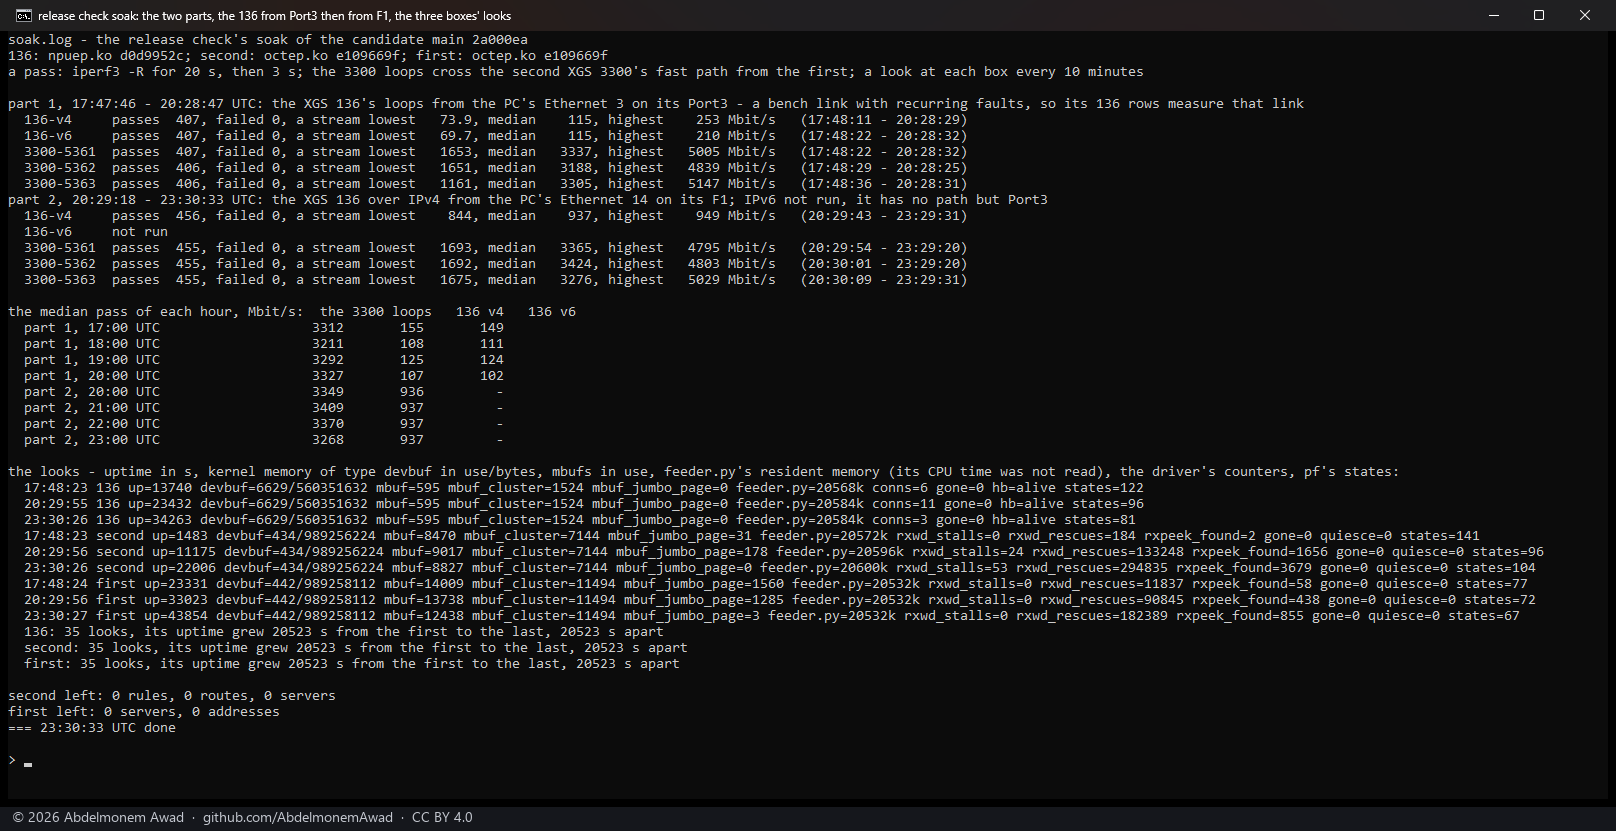
5 h 42 min of load on the candidate, all three appliances at once, from 17:47:46 to 23:30:33: the XGS 136 carrying one download stream at a time, 20 s a pass; three iperf3 loops from the first XGS 3300 through the second's translation and fast path; every ten minutes, each box's uptime, kernel memory of type devbuf, the mbufs in use, feeder.py's resident memory, the driver's own counters and pf's states. The XGS 136 came to it with its link to its coprocessor down since F2's third run (1010), so every reader of its coprocessor used the console throughout.
| part 1, 17:47:46-20:28:47 | part 2, 20:29:18-23:30:33 | |
|---|---|---|
| the XGS 136's streams came from | the PC's card on its Port3, the bench link of 1006 | the PC's card on its F1 |
| the XGS 136, IPv4 download, Mbit/s | 115 [73.9-253], 407 - that link's rate, not the 136's | 937 [844-949], 456 |
| the XGS 136, IPv6 download, Mbit/s | 115 [69.7-210], 407 - the same | not run: it has no path but Port3 |
| the three loops through the second XGS 3300, Mbit/s | 3,337, 3,188 and 3,305 [1,161-5,147], 1,219 | 3,365, 3,424 and 3,276 [1,675-5,029], 1,365 |
| passes that failed | 0 of 2,033 | 0 of 1,821 |
The median pass of each hour stayed between 3,211 and 3,409 Mbit/s for the loops through the second XGS 3300 in both parts, and at 936-937 Mbit/s for the XGS 136 on F1. At the boxes, in 35 looks each:
- None restarted: each one's uptime grew 20,523 s between its first look and its last, 20,523 s apart.
- Kernel memory of type devbuf was the same at every look, to the byte: 6,629 allocations and 560,351,632 bytes on the XGS 136, 434 and 989,256,224 on the second XGS 3300, 442 and 989,258,112 on the first.
- The mbufs in use moved with the load and did not climb: 595 at every look on the XGS 136; 8,470, 9,017 and 8,827 on the second XGS 3300 at the first look, at 20:29 and at the last; 14,009, 13,738 and 12,438 on the first.
- feeder.py's resident memory: 20,568 KiB at the first look and 20,584 KiB at the last on the XGS 136, 20,572 and 20,600 KiB on the second XGS 3300, 20,532 KiB at every look on the first. Its CPU time was not read (corrections, below).
gonewas 0 at every look on all three,quiesce0 on both XGS 3300s, and the XGS 136's heartbeat alive.- On the second XGS 3300, which forwarded the three loops,
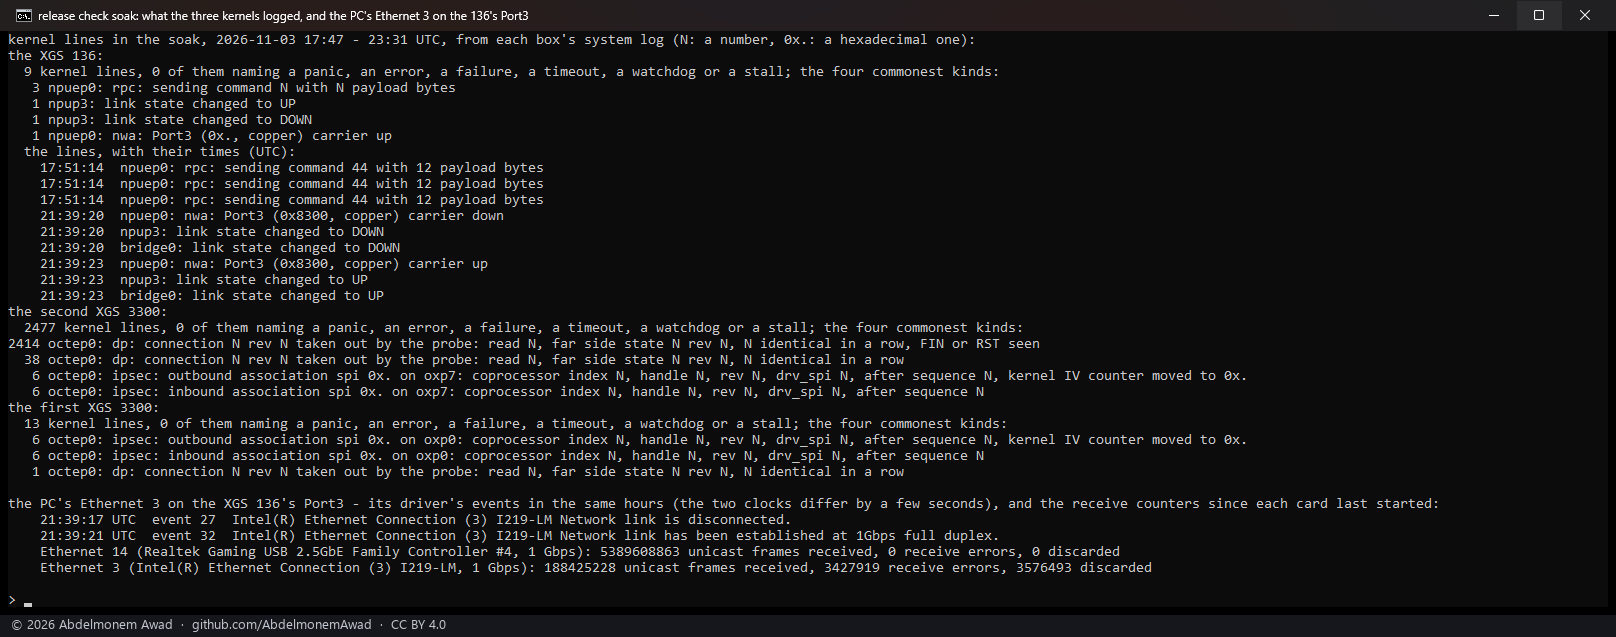
rxwd_stalls- rings left with packets in them, the counter that should not move - moved: 0 at the first look, 24 at 20:29, 53 at the last. The receive watchdog found and emptied each one, and no pass failed (361, open). On the first XGS 3300 it stayed 0. - Each box's system log from 17:47 to 23:31 (photo 61) holds no kernel line naming a panic, an error, a failure, a timeout, a watchdog or a stall. The second XGS 3300 logged 2,477 kernel lines, 2,452 of them its probe taking out connections that had ended and 12 on IPsec associations; the first 13, 12 of them on IPsec associations; the XGS 136 9: three of its driver's RPC at 17:51:14, and Port3's carrier down at 21:39:20 and up at 21:39:23, the PC's card on that link logging the same at 21:39:17 and 21:39:21. In part 2 that link carried only the looks' ssh; the 136's stream on F1 ran at 906 Mbit/s in the pass across the drop. The PC's card on Port3 had counted receive errors on 1.8 % of its frames since it started, 3,427,919 of 188,425,228; the card on F1 none in 5,389,608,863.
6. Found by reading the code, not run
- The wait of 996 when the route copy's rebuild fails for want of memory. The rebuild allocates
with
M_NOWAITand is retried after 50 ms, doubling up to about 51 s (fib_algo.c), while the detach waitsfib_max_sync_delay_msand 100 ms more. A failure there would leave a stale copy past the wait. It needs an allocation failure injected in the kernel; not run. - npu-run.sh exits 1 when it could not ask - the console's UART without its interrupt, no prompt, the markers not arriving - as when the coprocessor's Linux does not answer, and feeder.py reads both as a stop: a healthy coprocessor would be quiesced if its link were silent 30 s and asking failed at once. A trade-off between a missed stop and a false one, left as it is for now.
- After a quiesce, octep reads all-ones as a reset: a detach before the reset frees memory that a coprocessor still alive could write. Only by hand: recover.sh waits for the new boot before it detaches.
- Smaller:
octep_pollafter a quiesce; the watch asking a busy console again with no deadline; fastpath.py's time limit ending lockf, not recover.sh under it (985); the look's tries 3 and 4 with the MSI-X entry written again (an instrument off by default). contrib/npuep/reload.shdoes not give the host's link to its coprocessor its address again after the reload, as recover.sh does; in service nothing runs it without recover.sh.contrib/npuep/reload.shdoes give it, throughmgmt-link.sh coprocessoras the boot does - once, and blind on the XGS 136 (1010): in this review that try was not answered after 3 of the 15 reloads (F1's runs 5 and 10, and one of the five that loaded the morning's build), and after 1 of the 2 recoveries of F2. (Corrected the same evening: the link down before F2's first run was that, not a step reload.sh lacks.)octep'snpu-platform.sh, which reads the coprocessor's platform database over the console when an expansion module is fitted, at every bring-up of the driver, writes to the console without its lock too; read in the code by a review, not seen failing.- fastpath.py writes its lines with the tag
octepon every appliance, the XGS 136 too, whose driver is npuep (photos 25-2 and 25-3).
7. Not checked, and why
- clang's static analyser (section 1); CodeQL in CI, clang's extra warnings and the three reviews were run instead.
- A boot from the 26.7 images: they are built from the release's tag after it is made. The candidate
changes neither the boot hook nor
xgs.inc, andtest-firewall-hook.pypassed in CI. - The XGS pages in a browser: they need the owner's login. Their 14 data sources were read on both XGS 3300s as the pages run them (photos 03 and 05), and the candidate changes no page and no PHP.
- Models not in the lab: XGS 2100, 2300, 3100, 87, 107 and 126.
- A fourth boot of the second XGS 3300 (A's second): three were run, B, A, B.
- The times of 984 - Linkup and configd - in each recovery above: not read from the logs yet.
Corrections in the runs
- The XGS 136's streams ran from the PC's card on its Port3, a bench link with a record of faults - its carrier flapped through 2026-10-25, it came up at 100 Mbit/s on 2026-10-27 - and it was used all the same. Its download figures measure that link's state in each boot, not the 136 (1006); from 20:29 the soak's stream ran from the PC's card on the 136's F1.
- The soak's looks read feeder.py's resident memory, not its CPU time as planned: FreeBSD's
pstakes-o rss=,time=as rss alone, under the header,time=. And their count of kernel messages naming a panic or an error fell on the second XGS 3300 from 7 to 0 as its message buffer filled with the probe's lines, so it says nothing; each box's system log for the soak's hours was read instead (photo 61). - B's second series on the XGS 136 first began against a box still going down: a wait by ping after its shutdown came back too early. The series was run again from its start, and the waits now look for a new boot time.
- Every series on the XGS 136 ended with its flow maker off, from the HTTP runs' preparation; each series' iperf3 runs came first, on a fresh boot with it on, so the figures stand. Photo 13's part a ran with it off.
- The second XGS 3300, the sender for the XGS 136's series, was left on A through the XGS 136's second A series; the sender was then measured straight (photo 15).
- F1's first five runs loaded the morning's build,
4b721602, not the candidate, by a script's mistake. They lived and are not counted; their photograph does not show which module the reloads loaded, and is not published. F1 was run again with the module's md5 checked at every run. - Photo 24's devbuf memory is in bytes; its K is a label error.
- F2's first run is not a result (photo 25-1).
- F3's third run's "booted again: YES" is false: the boot time moved by one second.
- F3b's stop went over the console from inside a login, where it does not stop the console's getty: the
console kept answering, so F3b measured a stopped watchdog feeder with the link down.
1002 first took it for a stopped Linux, and
was corrected the same evening from the console's log. Its runs' "(0 s)" is taken before the stop's
command ran; that ended about 33 s later.
F3b is to be run again with the stop landing after its own session.Run again so on 2026-11-04 (F3b again, section 4). - F3b again's first run lost its own report: the script it ran was edited while it ran, and the shell read the rest of it at a shifted place ("Syntax error", photo 72). Its facts - no session on the console after the look of 00:39:00, gone 0 at the logger's last line, bit 25 - were read afterwards from the console's log, the logger's file and the boot's reset reason.
- Photo 22's dump lines, after the fix's result, are the candidate's dump of 11:48.
- feeder.py is named by its md5 in some photos and by its sha256 in the stop script's header: main's is
7c1a4728and7a3ac402, 1008'sb09fdad5and1843b3a4. - The watcher of the console's lock in the two F3 runs with the fix showed only itself (section 4).
- The XGS 136's link to its coprocessor stayed down from F2's third run (1010) through the soak, until F11's first run gave it its address at 23:43.
The discussion of this page is held in the project's GitHub Discussions. Showing it here loads giscus from giscus.app and GitHub, and writing in it needs a GitHub account - what that means.