The first wait after a give-back, 1,000 ms against 250 ms on the XGS 136: no clear difference, 2026-10-27
717: a stream whose data comes from the far side still goes through the XGS 136's host for part of some runs. The page before (revive-after-136-2026-10-27.md) found the heavy runs held: a connection given back soon after it was made stays with the host for a wait, a second doubling each time. It named a shorter first wait as what to measure next. Measured, 250 ms against 1,000 ms makes no clear difference. The counters show why: most of the frames that reach the host do not arrive during that wait.
What was built
npuep.ko 0bb45c40, built from the branch npuep-717-remake-wait, which is not merged. The first wait
comes from a sysctl, flow.remake_wait_ms - 1,000 by default, as since 2026-10-19 - so one build
measured both. It was loaded by hand on the XGS 136 (vendor version 21).
How it was measured
As on the page before (images/deploy/lab-717c.sh):
- The stream: a 15-second iperf3 stream with the data from the far side - the second XGS 3300, behind the XGS 136's Port8, sending.
- The PC: on the XGS 136's F1, at 1 Gbit/s.
- Each run: its pf states killed first,
flow.remake_wait_msset to 1,000 and 250 in turn. - The runs: two sets of 16, then six more at 250 ms that print every counter that moved.
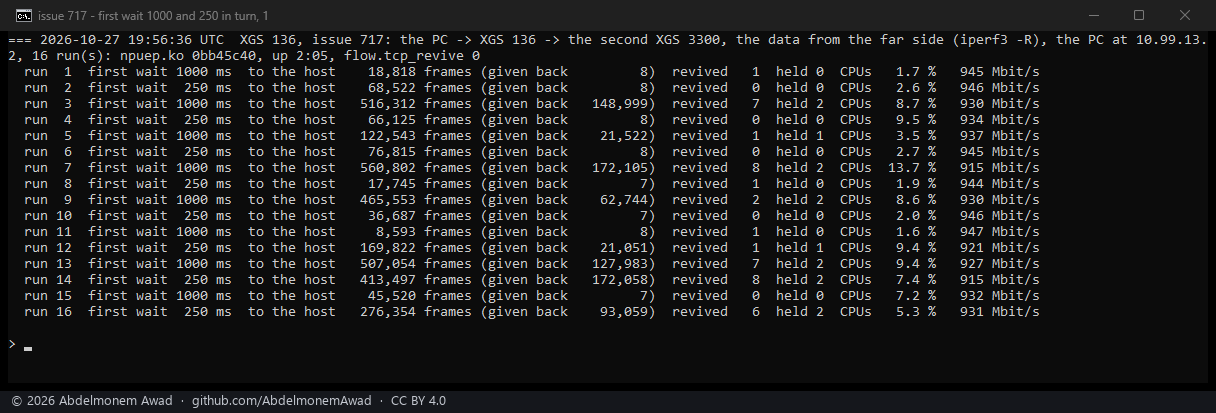
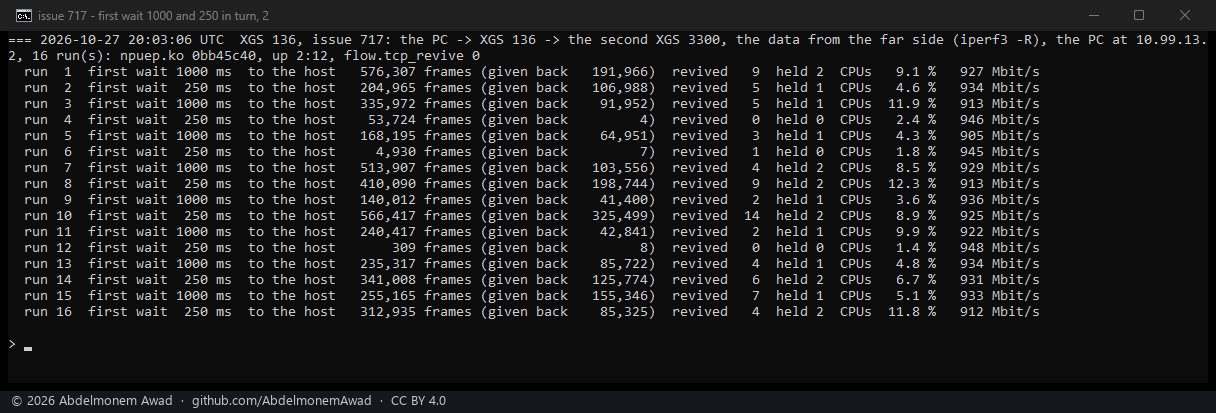
1,000 ms and 250 ms in turn
| first wait | runs | frames to the host, mean | median | runs above 300,000 | rate |
|---|---|---|---|---|---|
| 1,000 ms | 16 | 294,405 | 247,791 | 7 | 905 to 947 Mbit/s |
| 250 ms | 16 | 188,747 | 123,319 | 5 | 912 to 948 Mbit/s |
The mean and the median are lower at 250 ms. But under both settings the runs spread over two orders of magnitude and more - 8,593 to 576,307 frames at 1,000 ms, 309 to 566,417 at 250 ms - so sixteen runs each do not separate them. Runs with 250 ms sent 413,497 and 566,417 frames to the host, held twice, and revived the connection 8 and 14 times.
Where the frames go instead
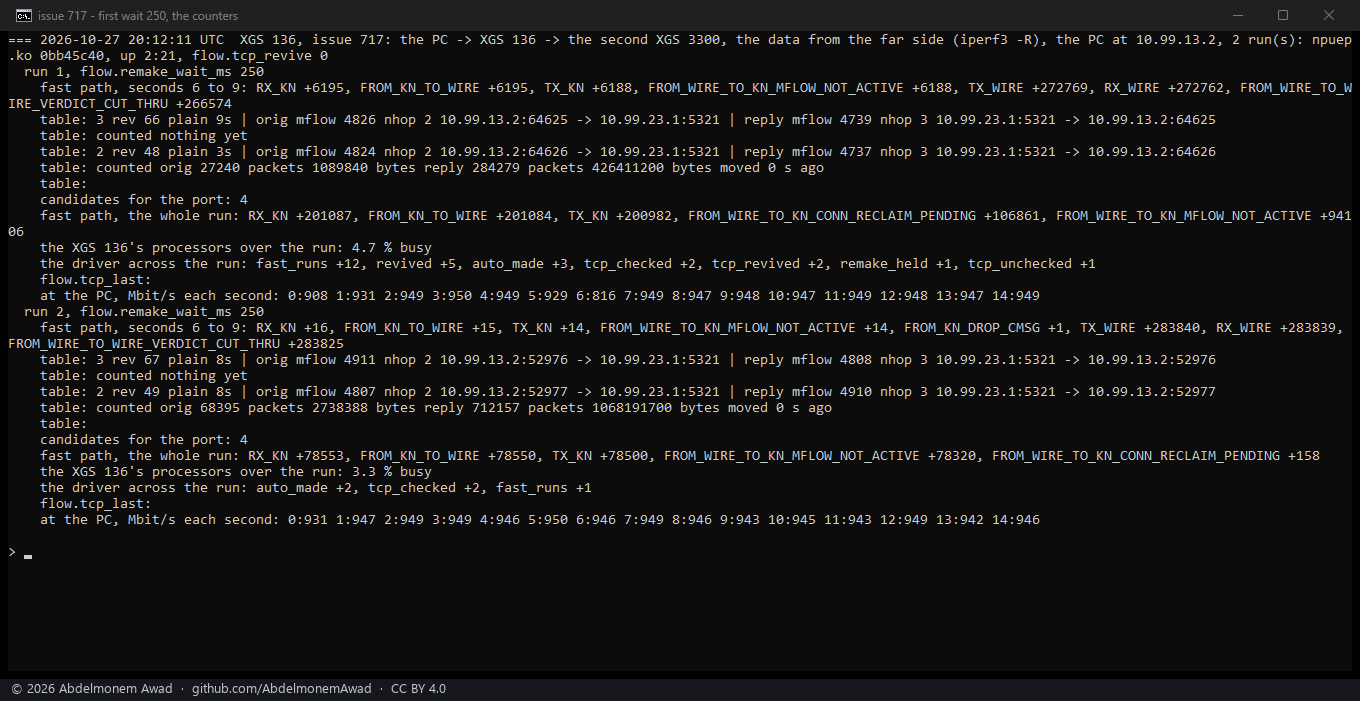
The six runs at 250 ms that print every counter; the photograph is the last two:
| run | to the host | the connection not active yet | given back | revived | held |
|---|---|---|---|---|---|
| 1 | 248,019 | 205,830 | 42,108 | 2 | 2 |
| 2 | 228,062 | 100,146 | 127,720 | 6 | 1 |
| 3 | 310,450 | 236,549 | 73,822 | 4 | 2 |
| 4 | 119,728 | 98,729 | 20,921 | 1 | 1 |
| 5 | 201,087 | 94,106 | 106,861 | 5 | 1 |
| 6 | 78,553 | 78,320 | 158 | 0 | 0 |
| all six | 1,185,899 | 813,680 (69 %) | 371,590 (31 %) |
The two kinds are the fast path's own counters:
- Not active yet is
FROM_WIRE_TO_KN_MFLOW_NOT_ACTIVE: a frame for a connection the fast path holds, but whose microflow is not active. - Given back is
FROM_WIRE_TO_KN_CONN_RECLAIM_PENDING: a frame for one it has given back.
What the six show:
- Most of the host's frames came while the connection was not active yet. That is 69 % of them over the six runs.
- A connection with no give-back still sent about a second of itself. Run 6 was never given back and never revived, and still sent 78,320 frames before its microflow was active - about a second of the stream, at the 78,000 frames a second that 930 Mbit/s makes.
- Others did far better. Runs in the two sets above sent as few as 309 and 4,930 frames in all, so that second is not fixed.
- The runs with give-backs sent more of the first kind too. They sent 94,106 to 236,549 frames for a connection not active yet, against run 6's 78,320. That reads as each revival also waiting before it is active; the counters do not time it.
What remains
The first wait is not the lever: flow.remake_wait_ms stays unmerged, and
717 stays open. The next measurement is
per connection: from the moment the driver makes it to the moment its microflow is active. That shows
why it is a second on one run and almost nothing on another, and why the fast path gives the same
connection back several times in a fifteen-second stream.
The discussion of this page is held in the project's GitHub Discussions. Showing it here loads giscus from giscus.app and GitHub, and writing in it needs a GitHub account - what that means.